Development Blog
Got an idea? Chase me down on reddit at u/fantasyfootballtiers, or shoot me an email: hello [at] fantasyfootballtiers.com.
Advertisement
Go live: markers and values for players scoring above/below expectation
December 16, 2022
- I've implemented new functionality on the RB, WR and TE positions and I think that's enough to justify going live with it. Here's a sample plot:
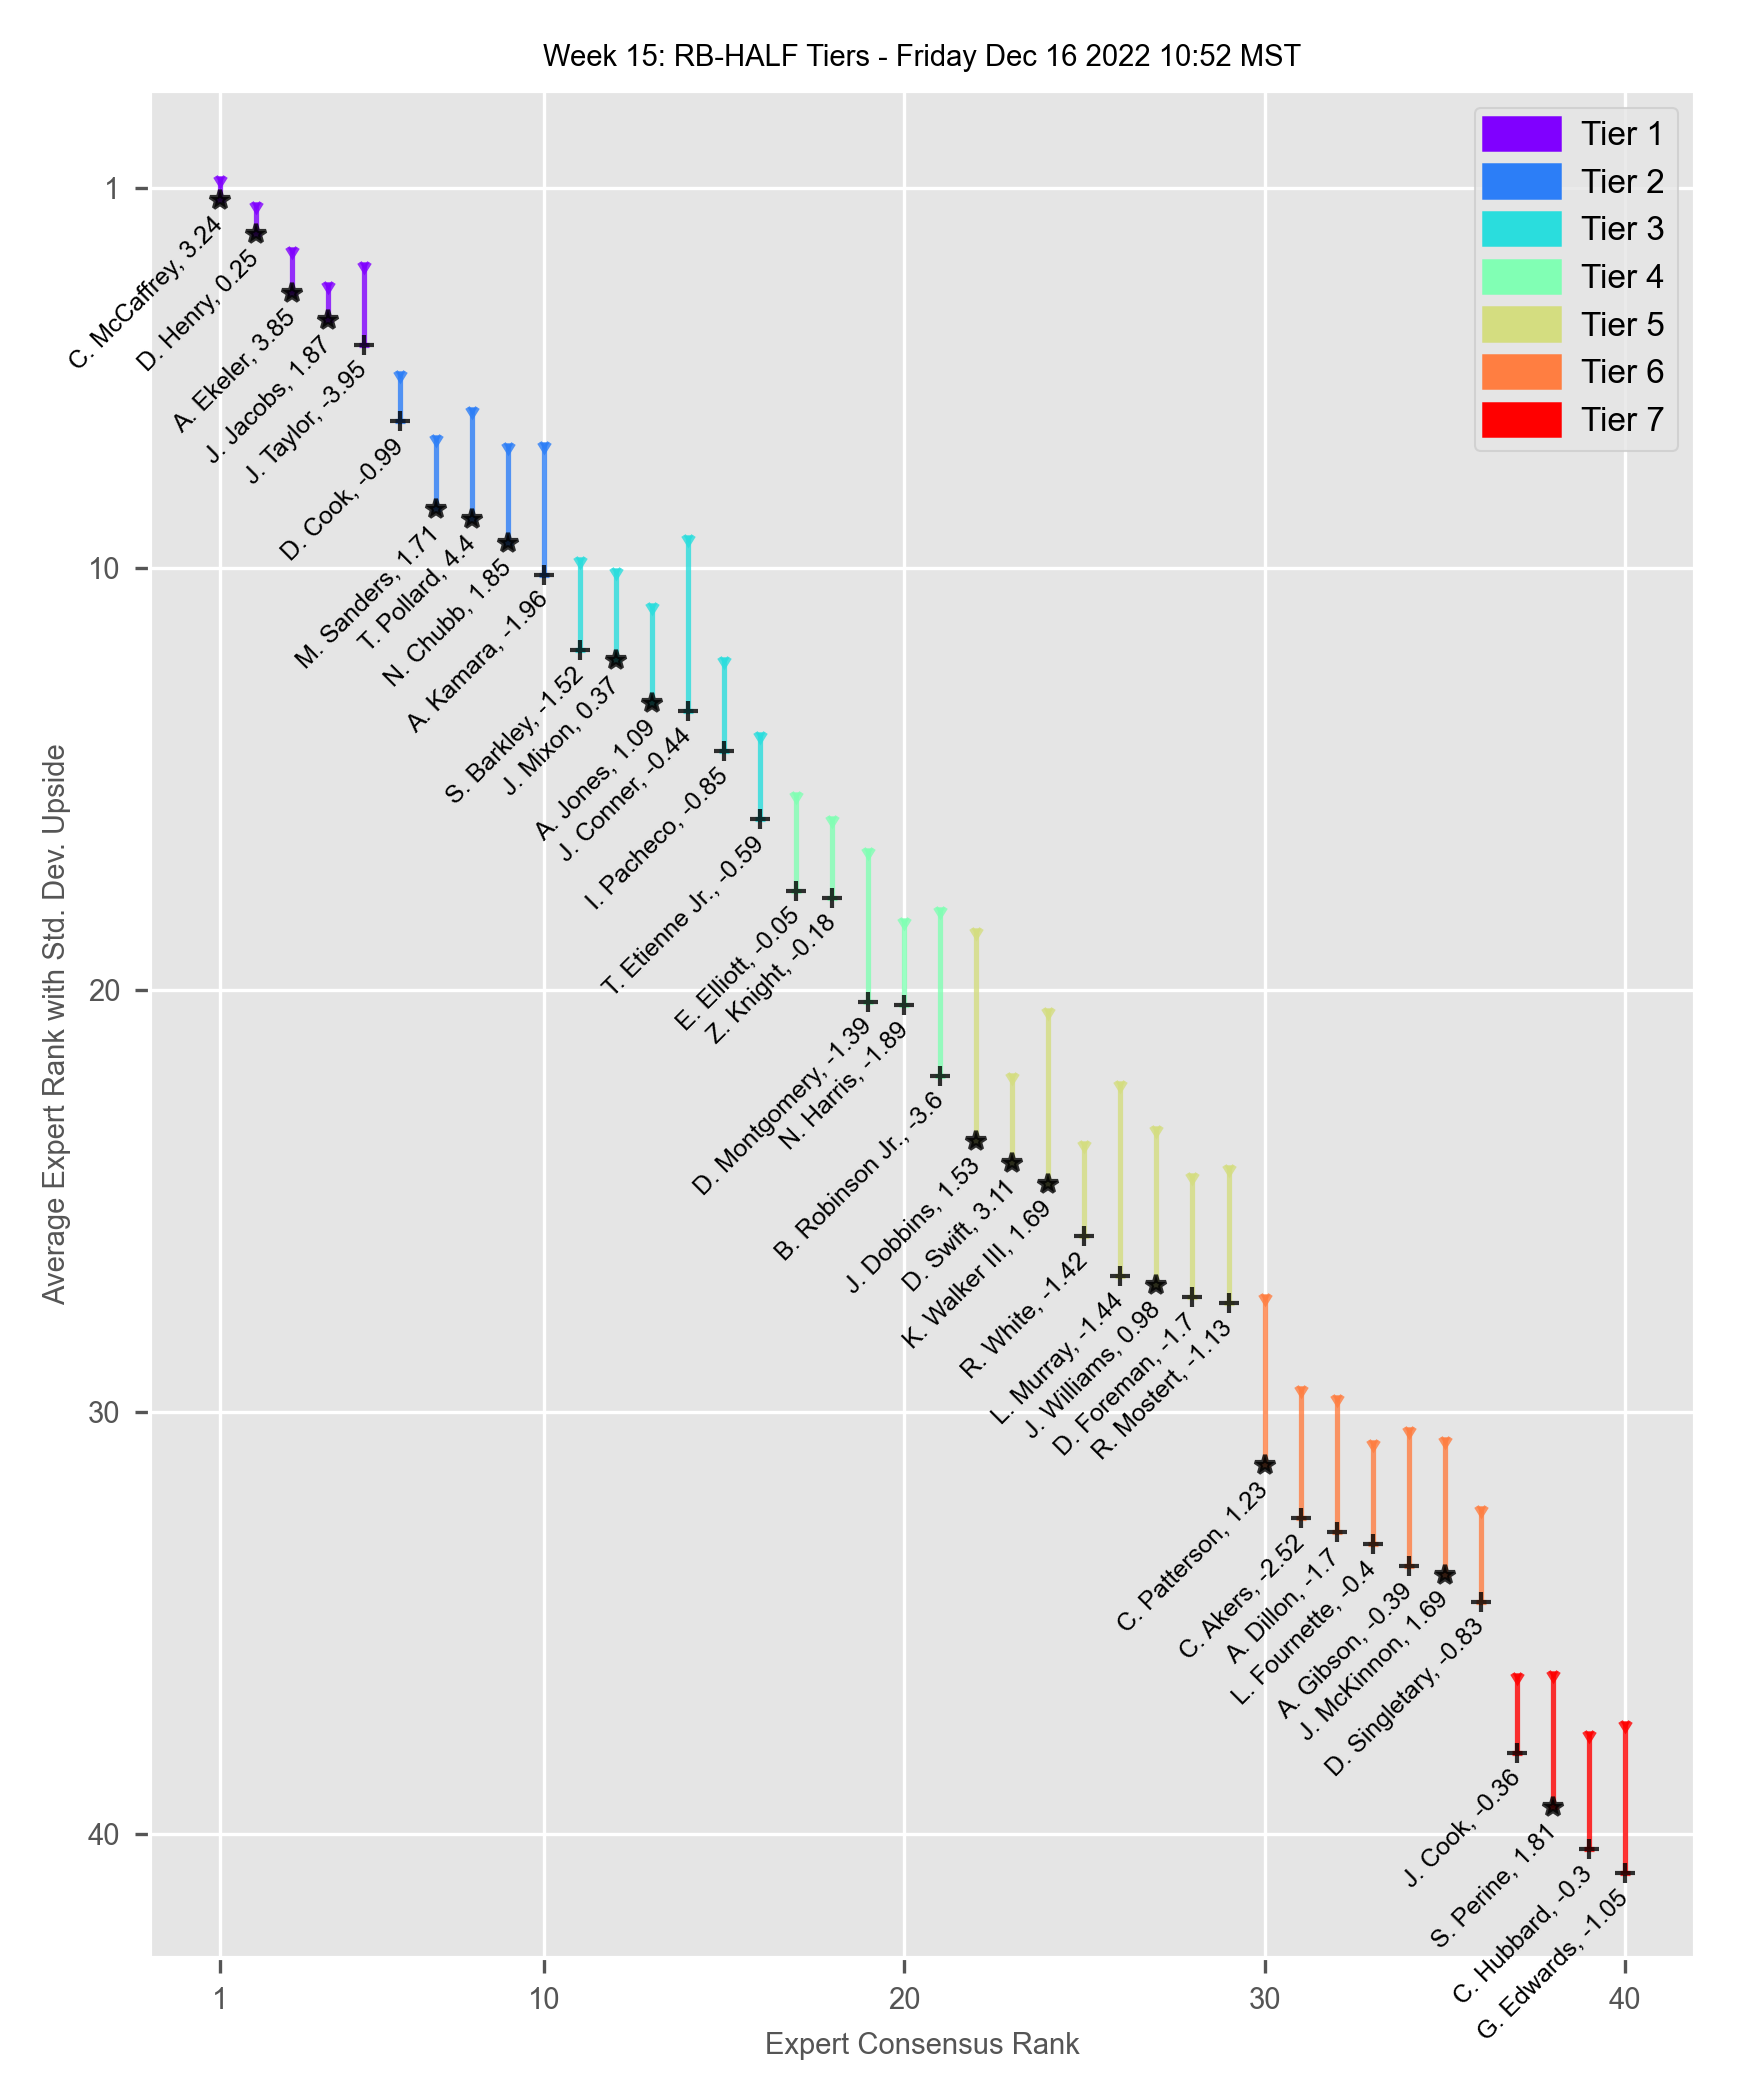
As discussed in the last post, the player markers now indicate whether a player is performing above or below fantasy point scoring expecations. A STAR indicates scoring above expectation, and a PLUS (I switched this up from an X) indicates scoring below expectation.
The expected fantasy points level is determined by a regression between opportunities per game (targets plus attempts for the RB, WR, and TE positions) and fantasy points per game. In addition to the marker, the value of points above/below expectation are shown alongside players' names. For example, in this sample plot you can see that Austin Ekeler makes the most of his touches, scoring 3.85 fantasy points per game higher than expected based on the opportunities he's given; conversely, Jonathan Taylor is not making good use of his touches, scoring 3.95 points lower than expected (shown on the plot with a negative sign as -3.95).
The feedback I've received so far has been positive, so hopefully others find this data useful. It helps to highlight who you might be more willing to take a chance on when deciding between players. As mentioned in the last post as well, it's also useful for identifying which players to target/trade/drop throughout the season.
Next up: implementation for the QB, K and DST positions.
Prototype: markers to indicate player scoring above/below expectation
December 6, 2022
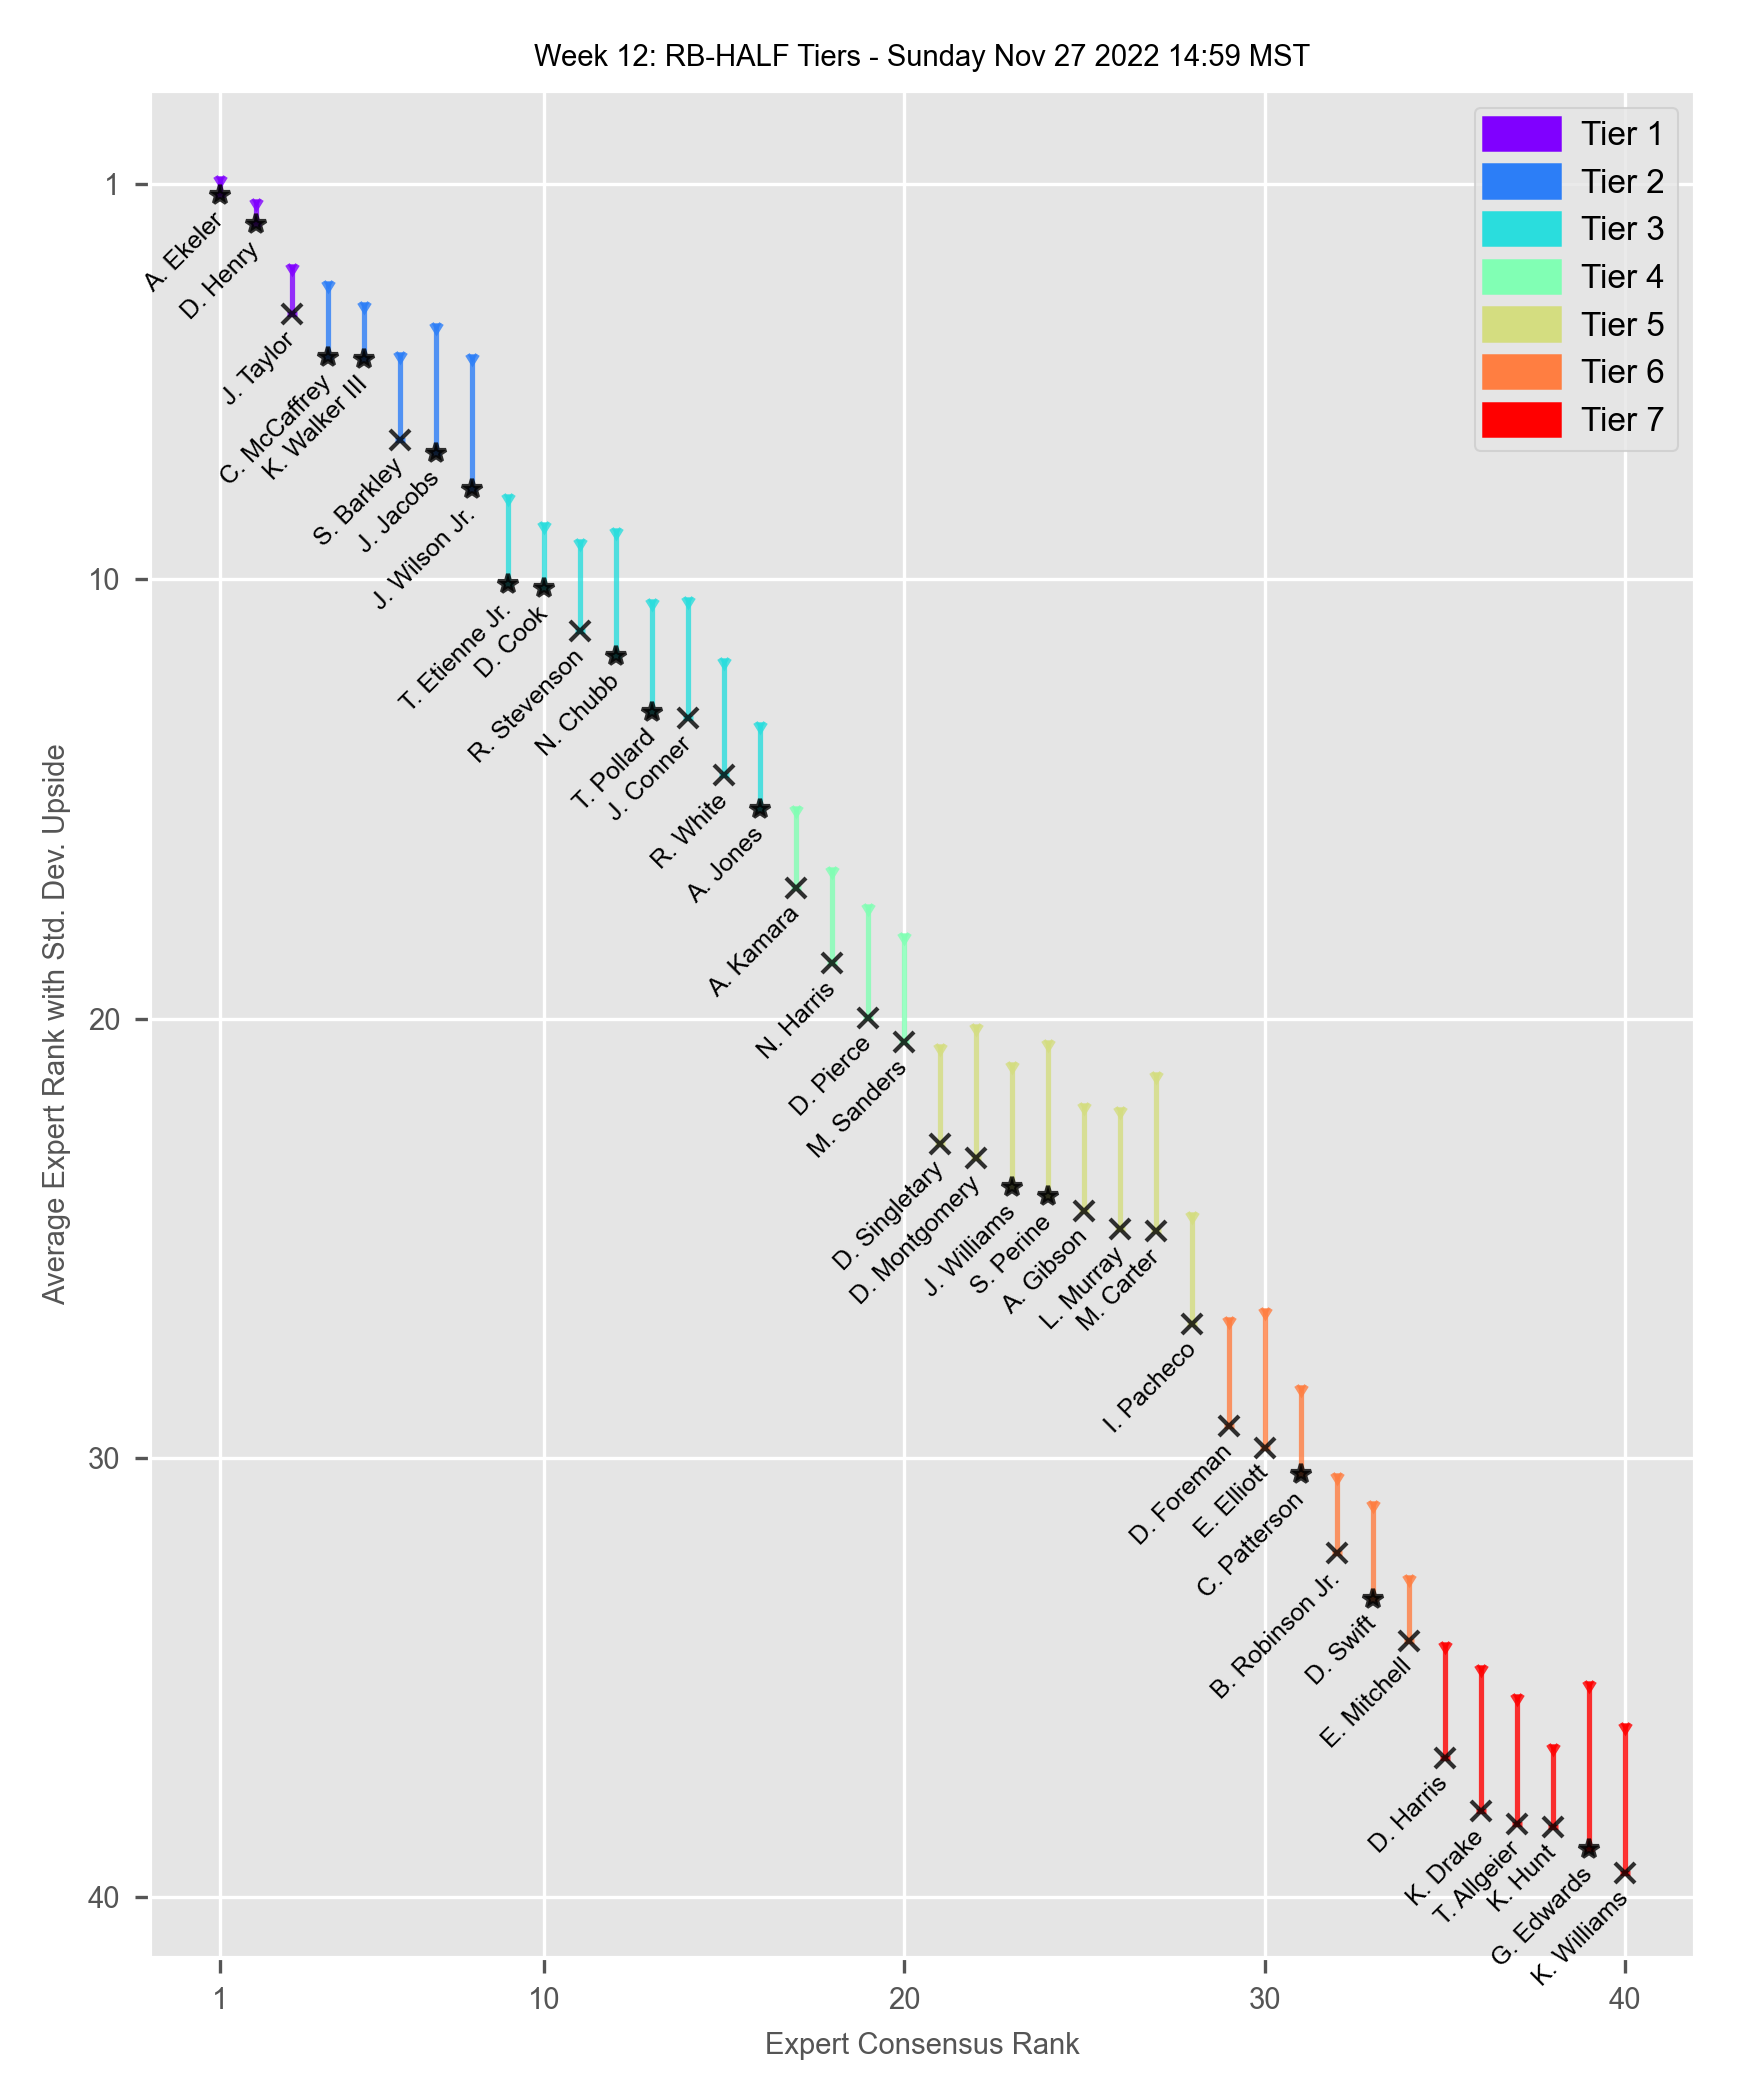
- What if markers were indicators for whether a player is scoring above or below expectation over the course of the season so far given their average opportunities?
- A STAR indicates that a player has scored fantasy points ABOVE expectation
- An X indicates that they have scored fantasy points BELOW expectation.
- Point expectation is determined by a regression analysis between opportunities per game and fantasy points per game.
- The important bit, the reason WHY a player is performing above/below, is up to you. For example, consider Jonathan Taylor who has scored well below expectation:
- Is he inefficient with his touches?
- Is it because his team doesn't script the offense to take advantage of his ability?
- Is his scenario going to continue?
- The answers to those questions are important because the players who are performing below expectations due to temporary reasons represent potential value as trade targets or waiver wire pickups. Conversely, this indicator helps you identify sell-high candidates on your team.
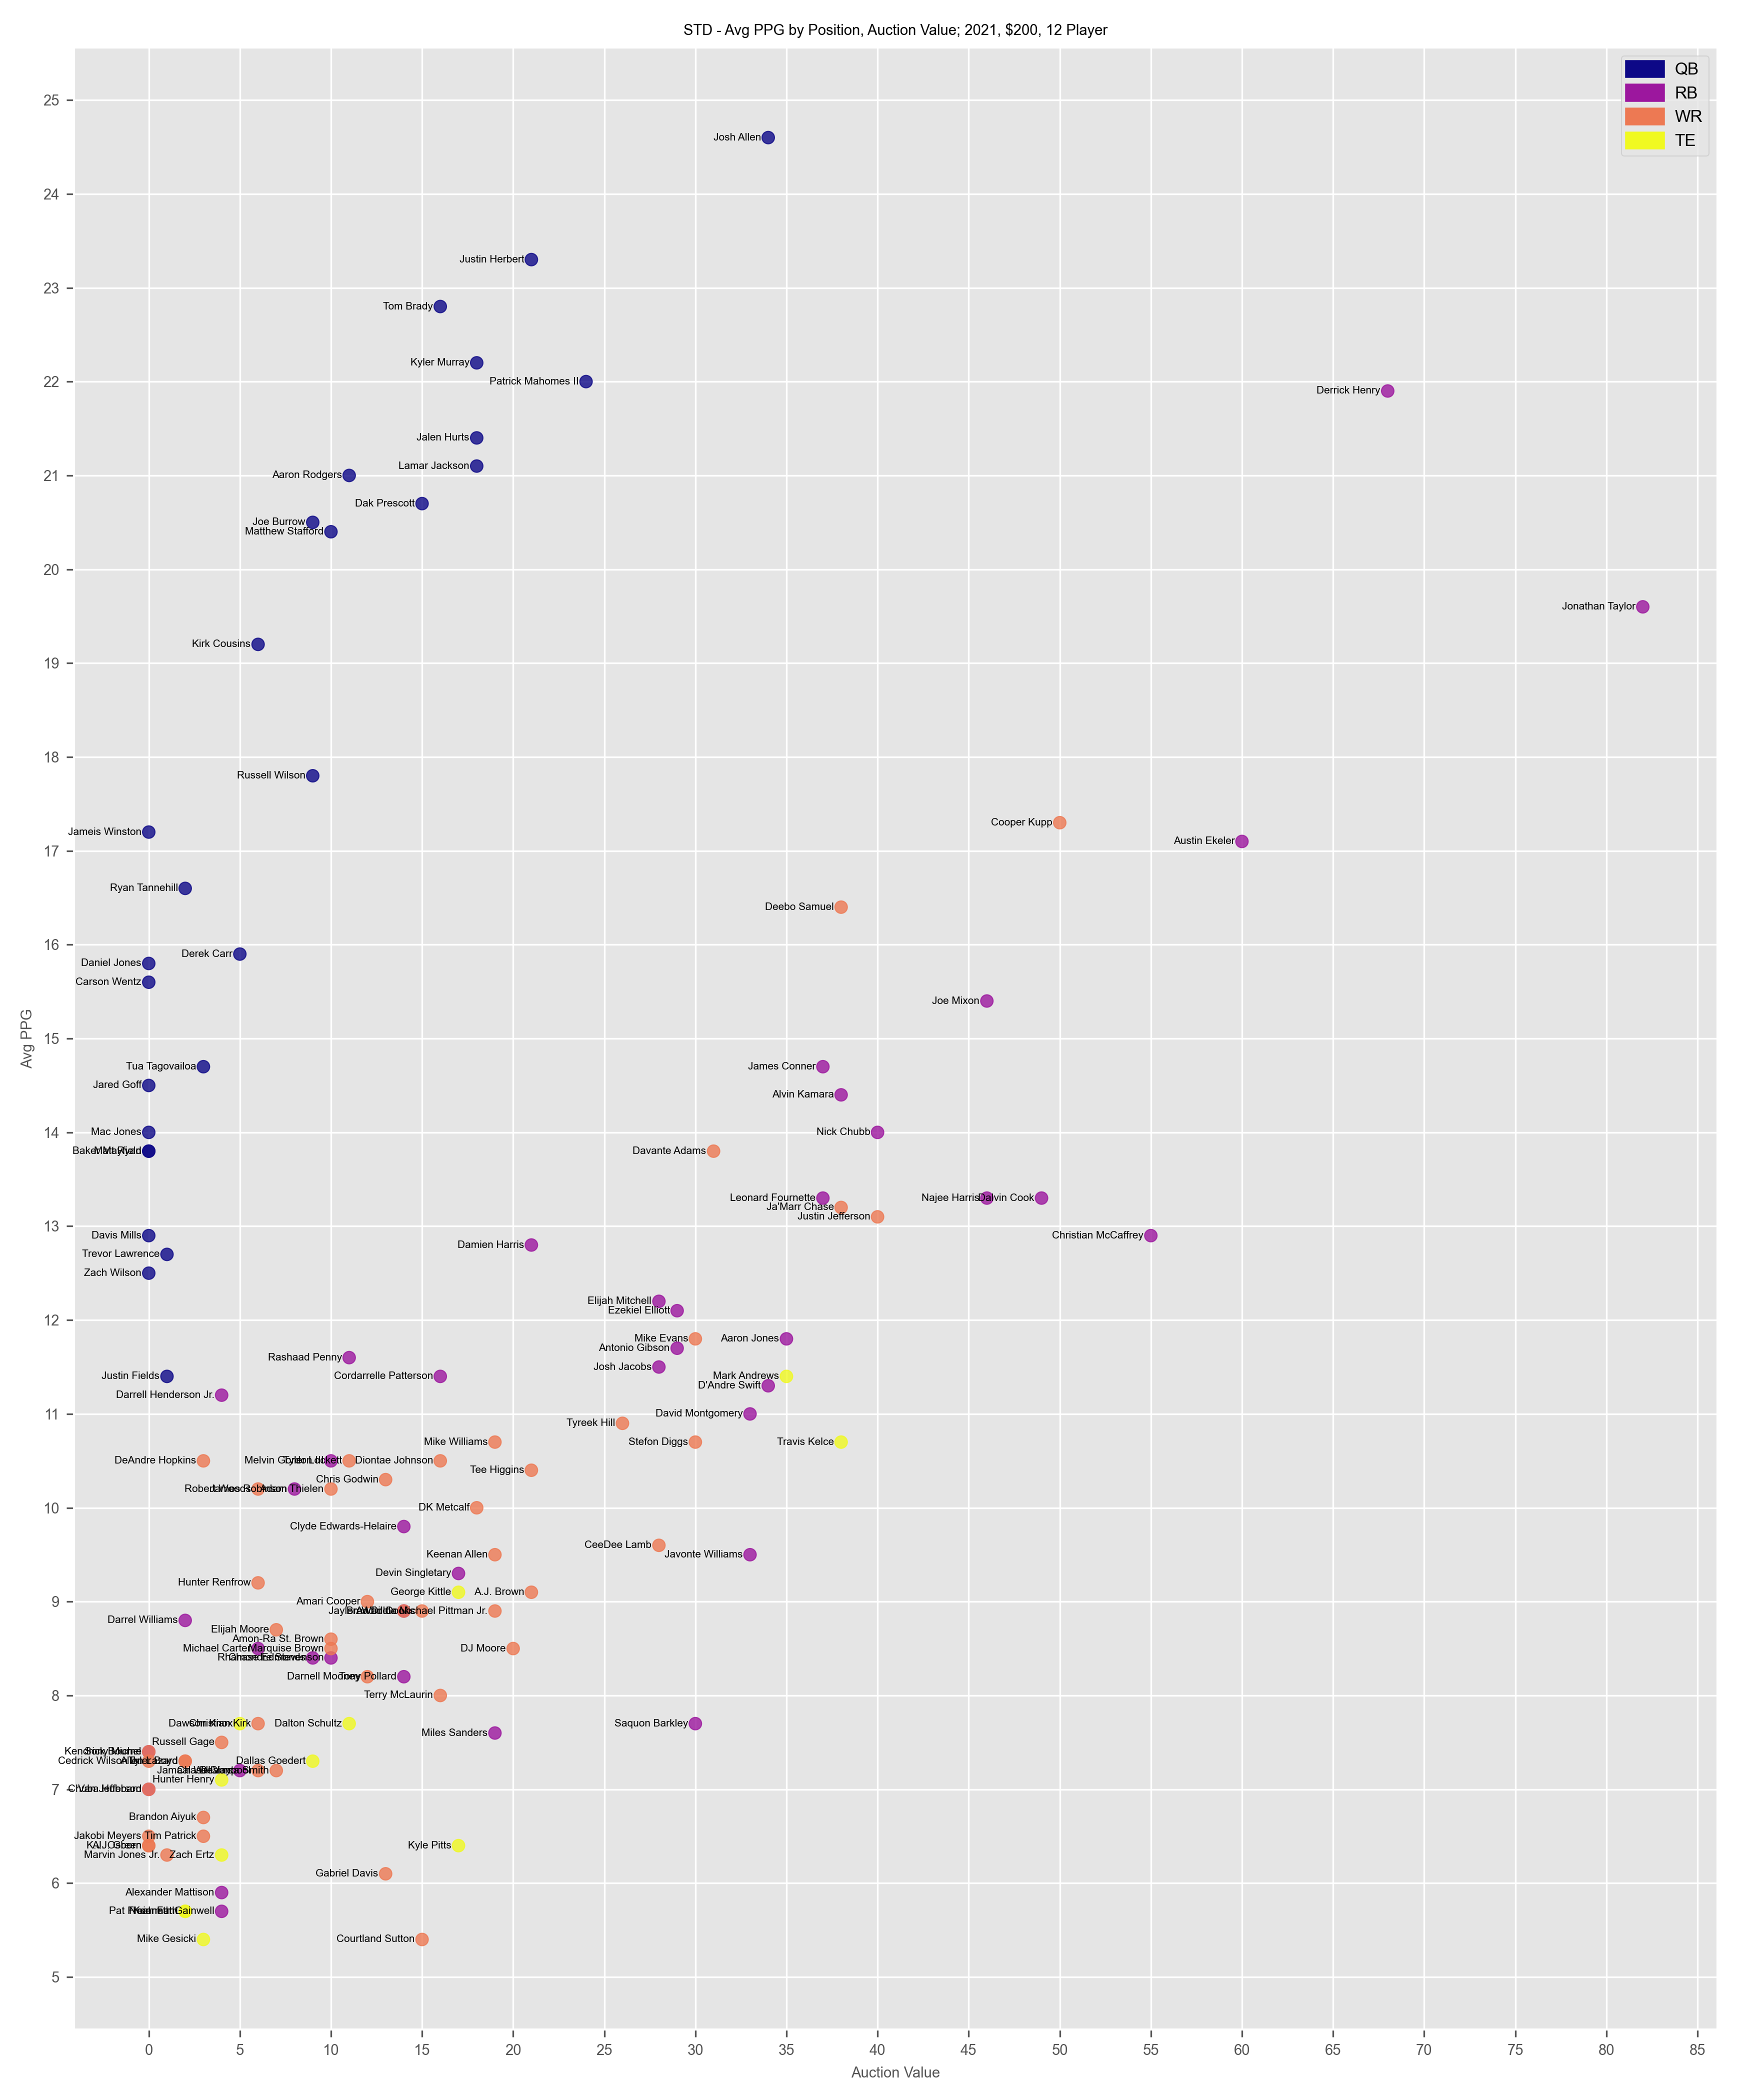
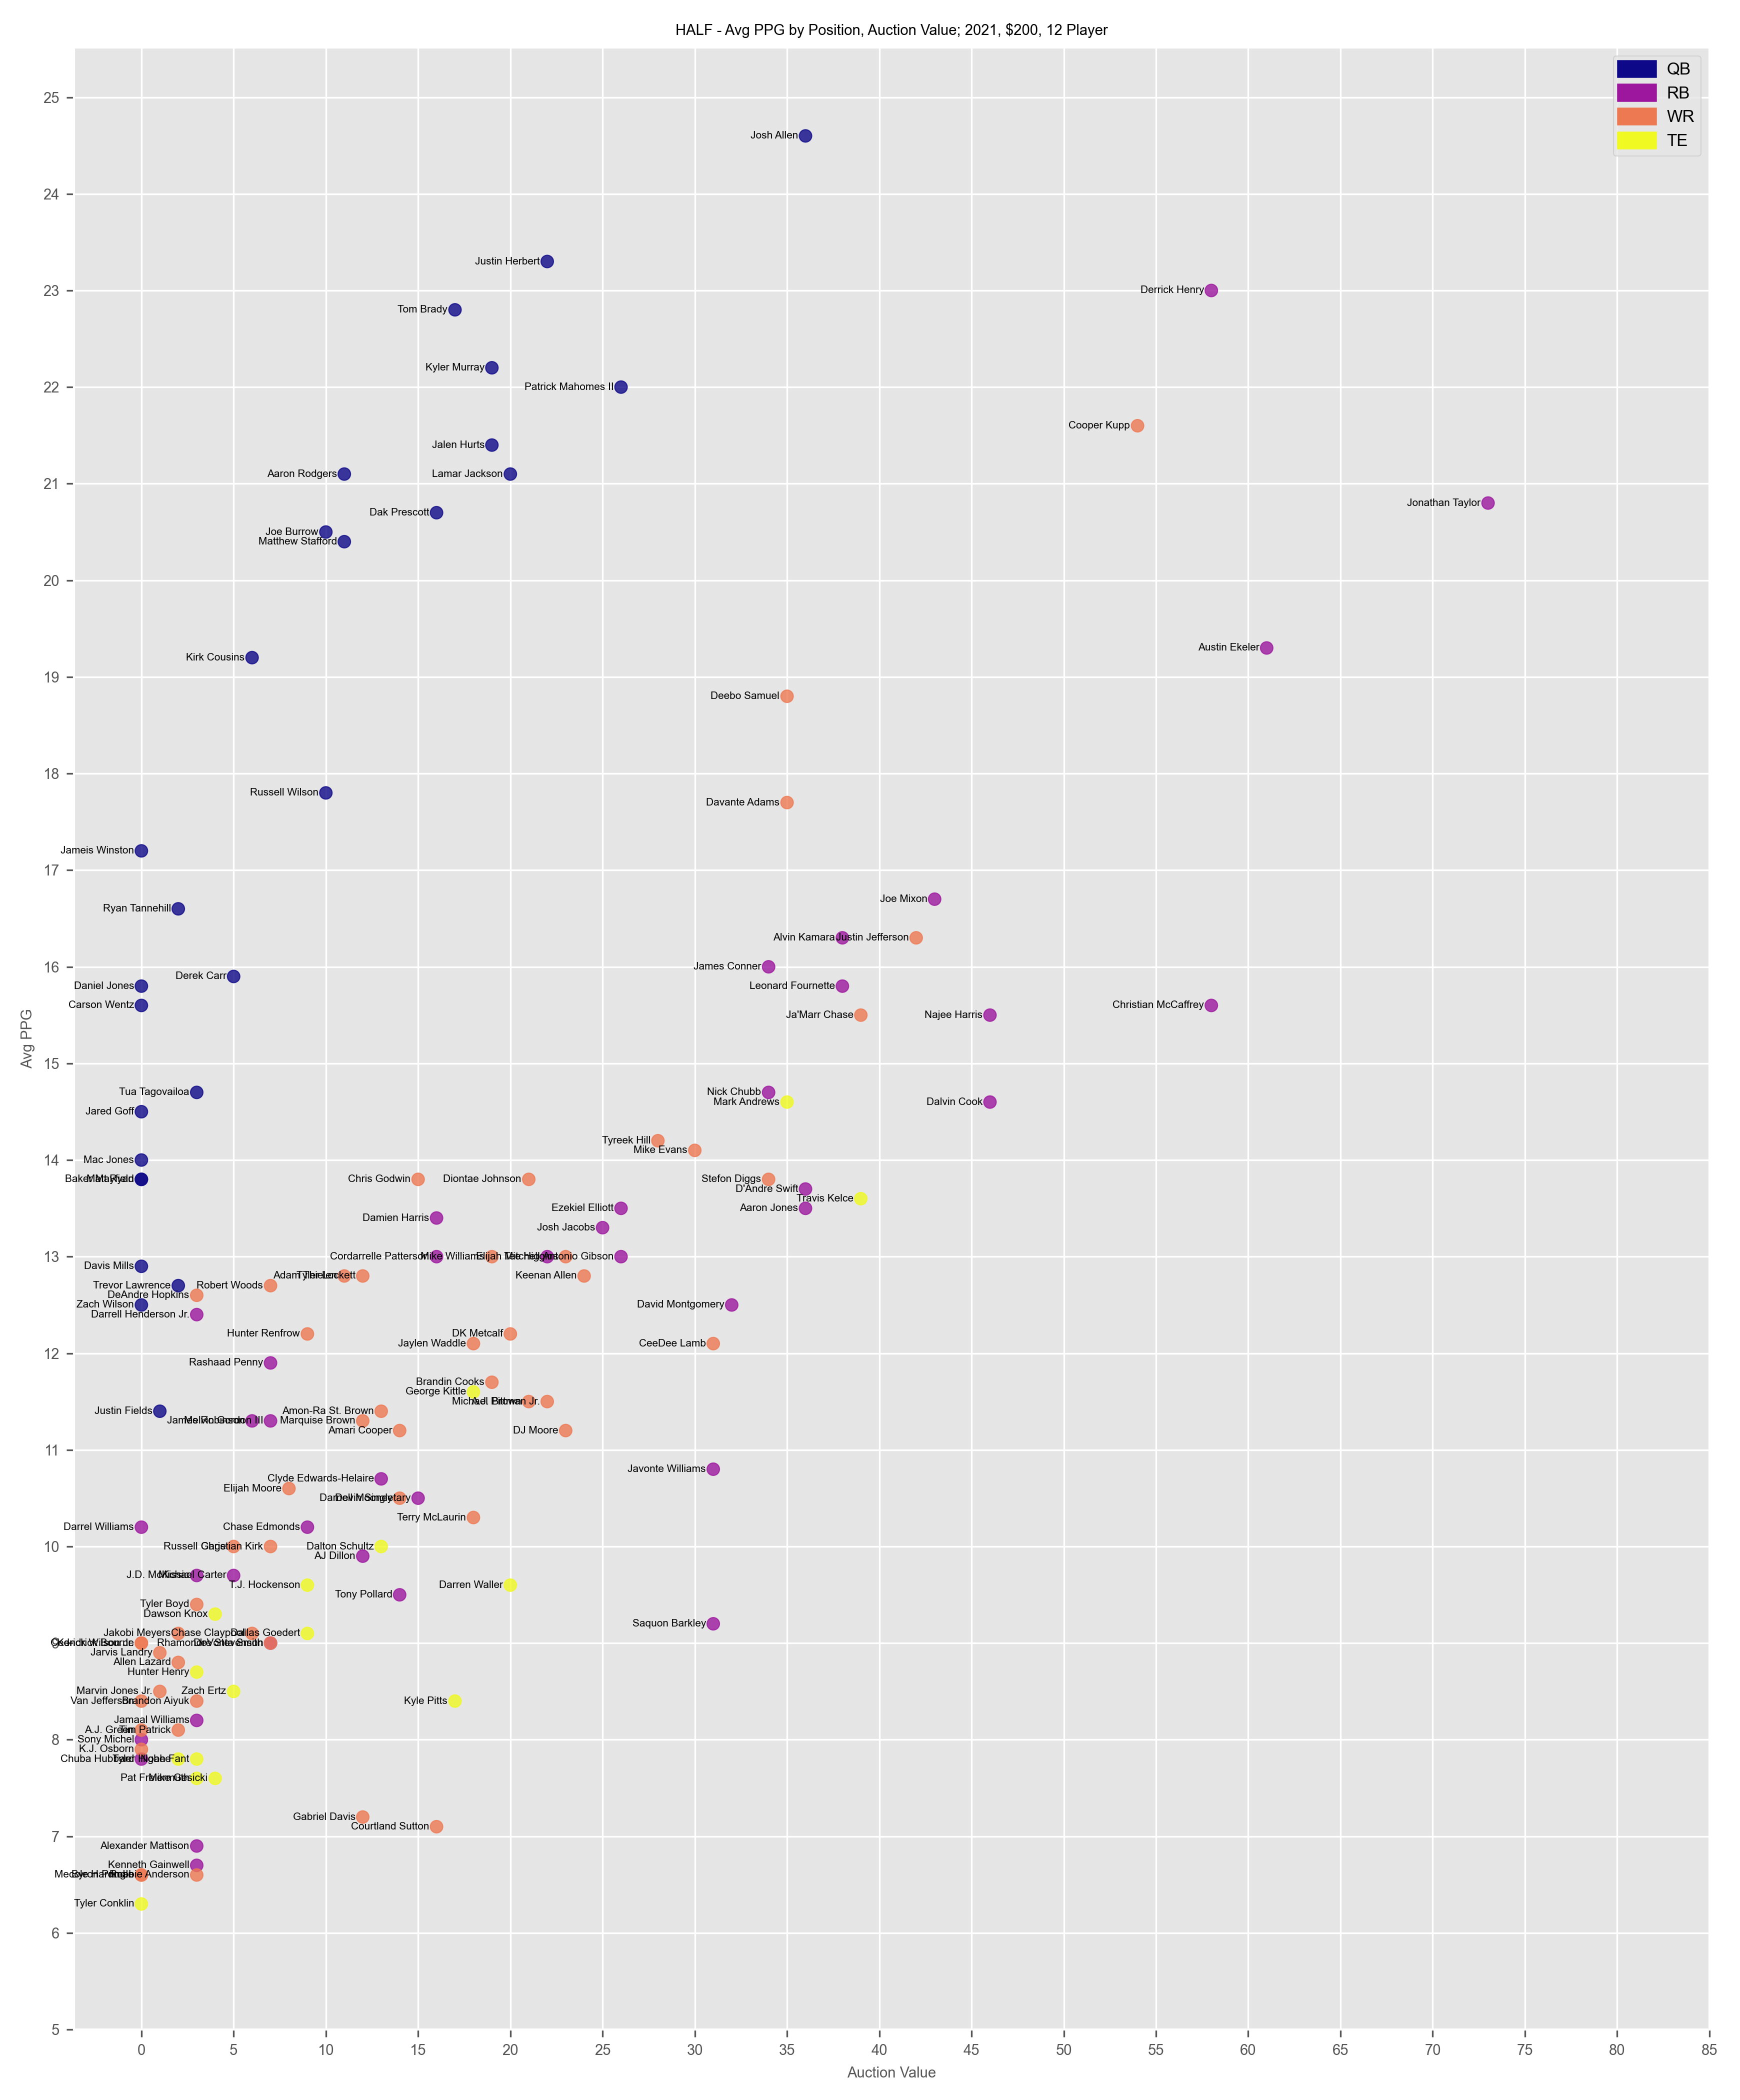
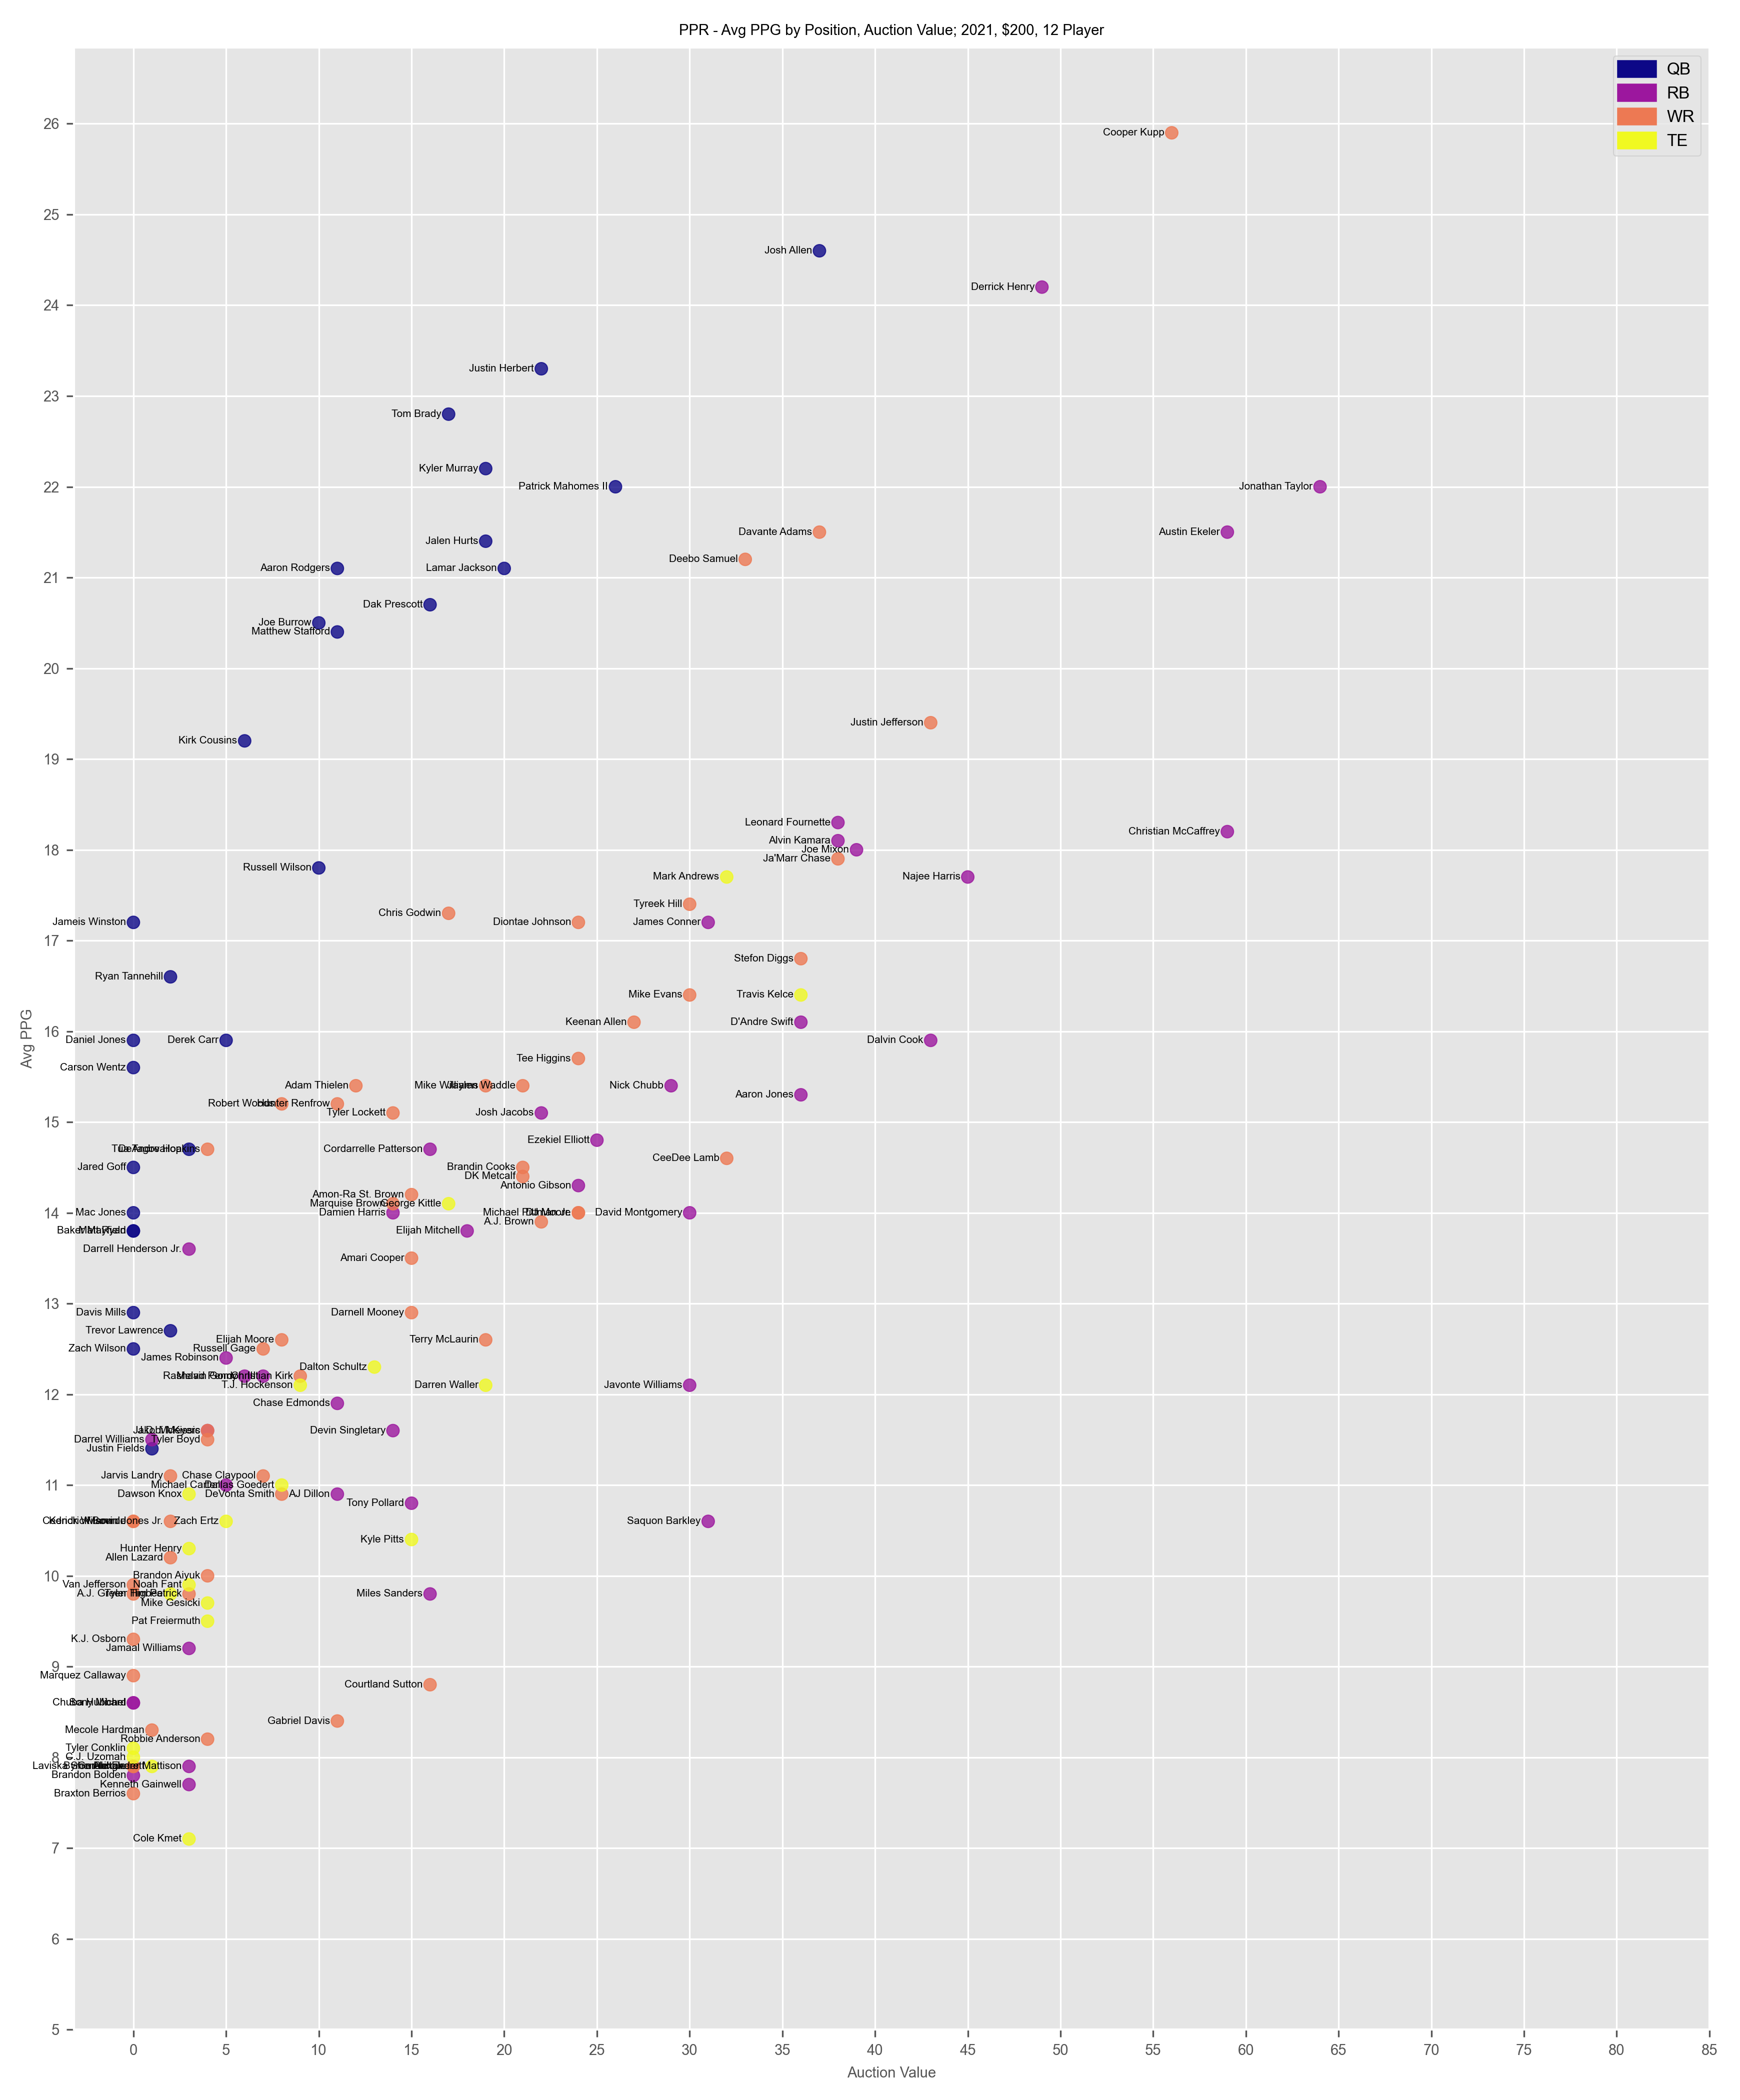
Prototype: average PPG by position, auction Value; 2021, $200 budget, 12-player league
July 20, 2022
- Credit to u/Auctiondraftsrule for the idea. Pretty cool. Shows some interesting auction behaviour... for example, in Half-PPR, Josh Allen looks like a steal of a deal. Scarcity has a huge impact on top RBs. On average, people value D. Cook, N. Harris, and CMC over J. Mixon, A. Kamara and J. Conner despite the better 2021 performance of the second set of RBs. This of course suggests that league managers value upside and historical performance over recency (which makes some sense - nobody would argue Conner is the superior player to CMC).
By popular demand: average PPG by position, round per 2021 ADP, including player names
July 19, 2022
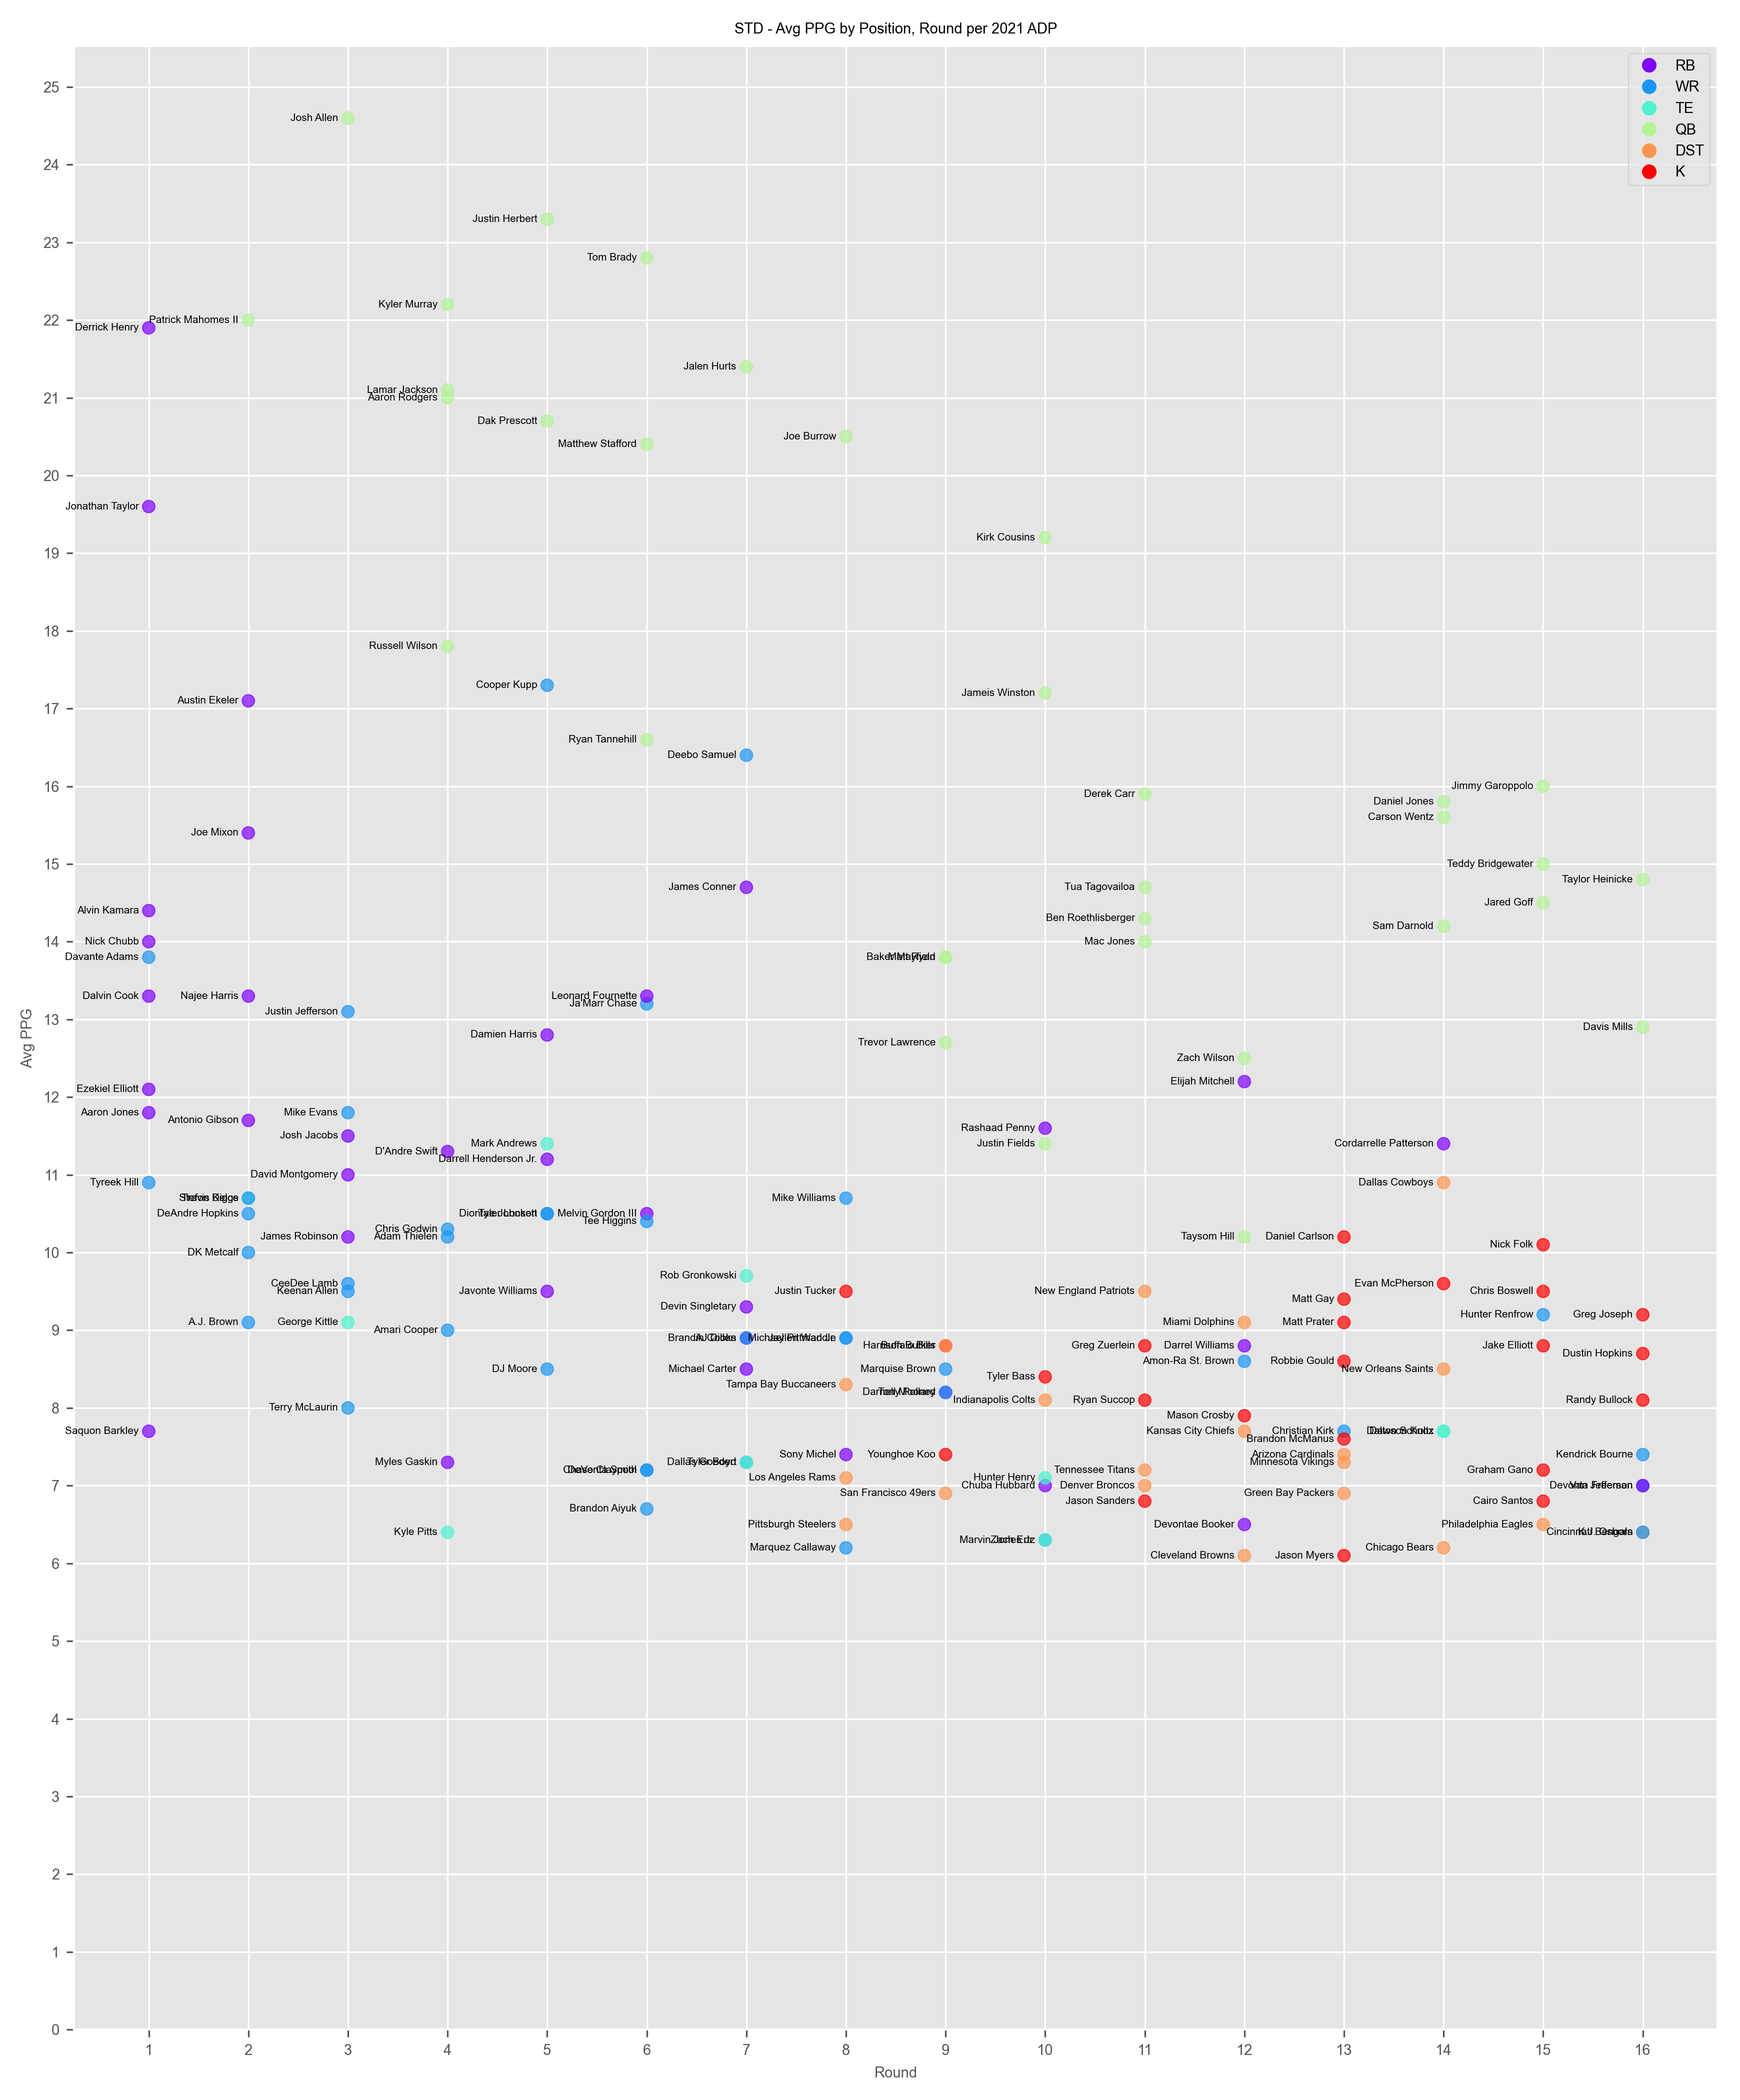
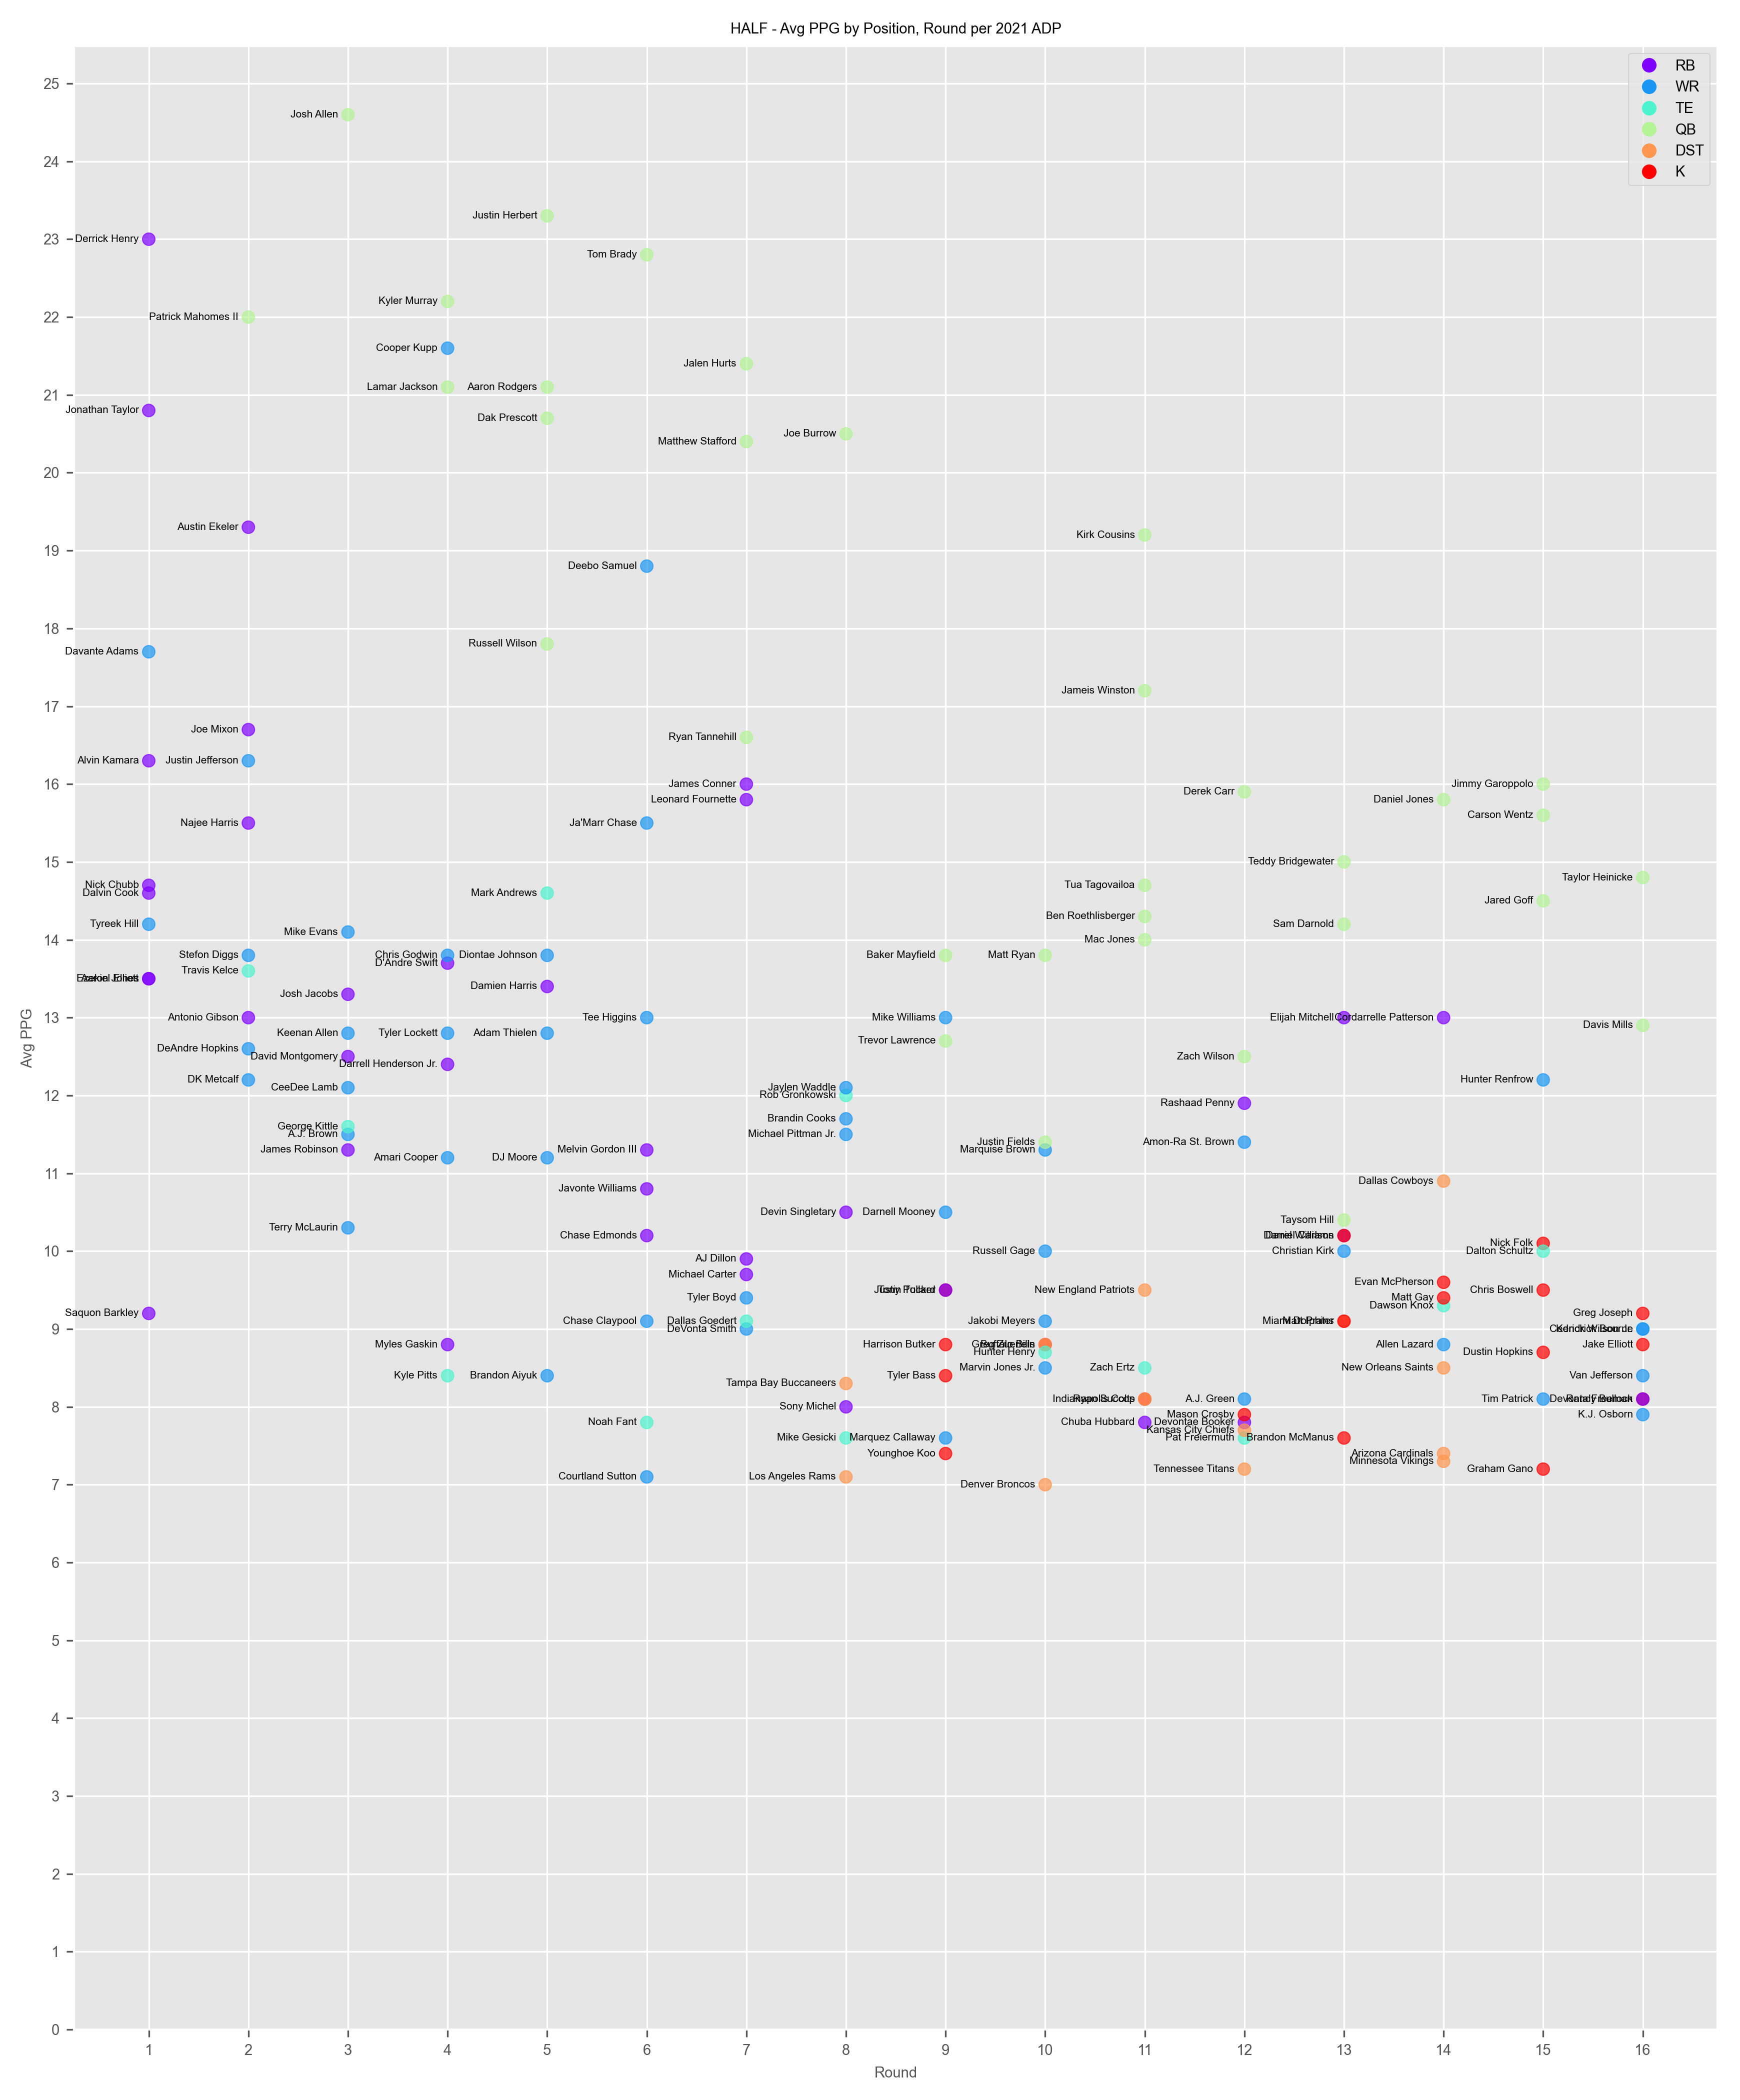
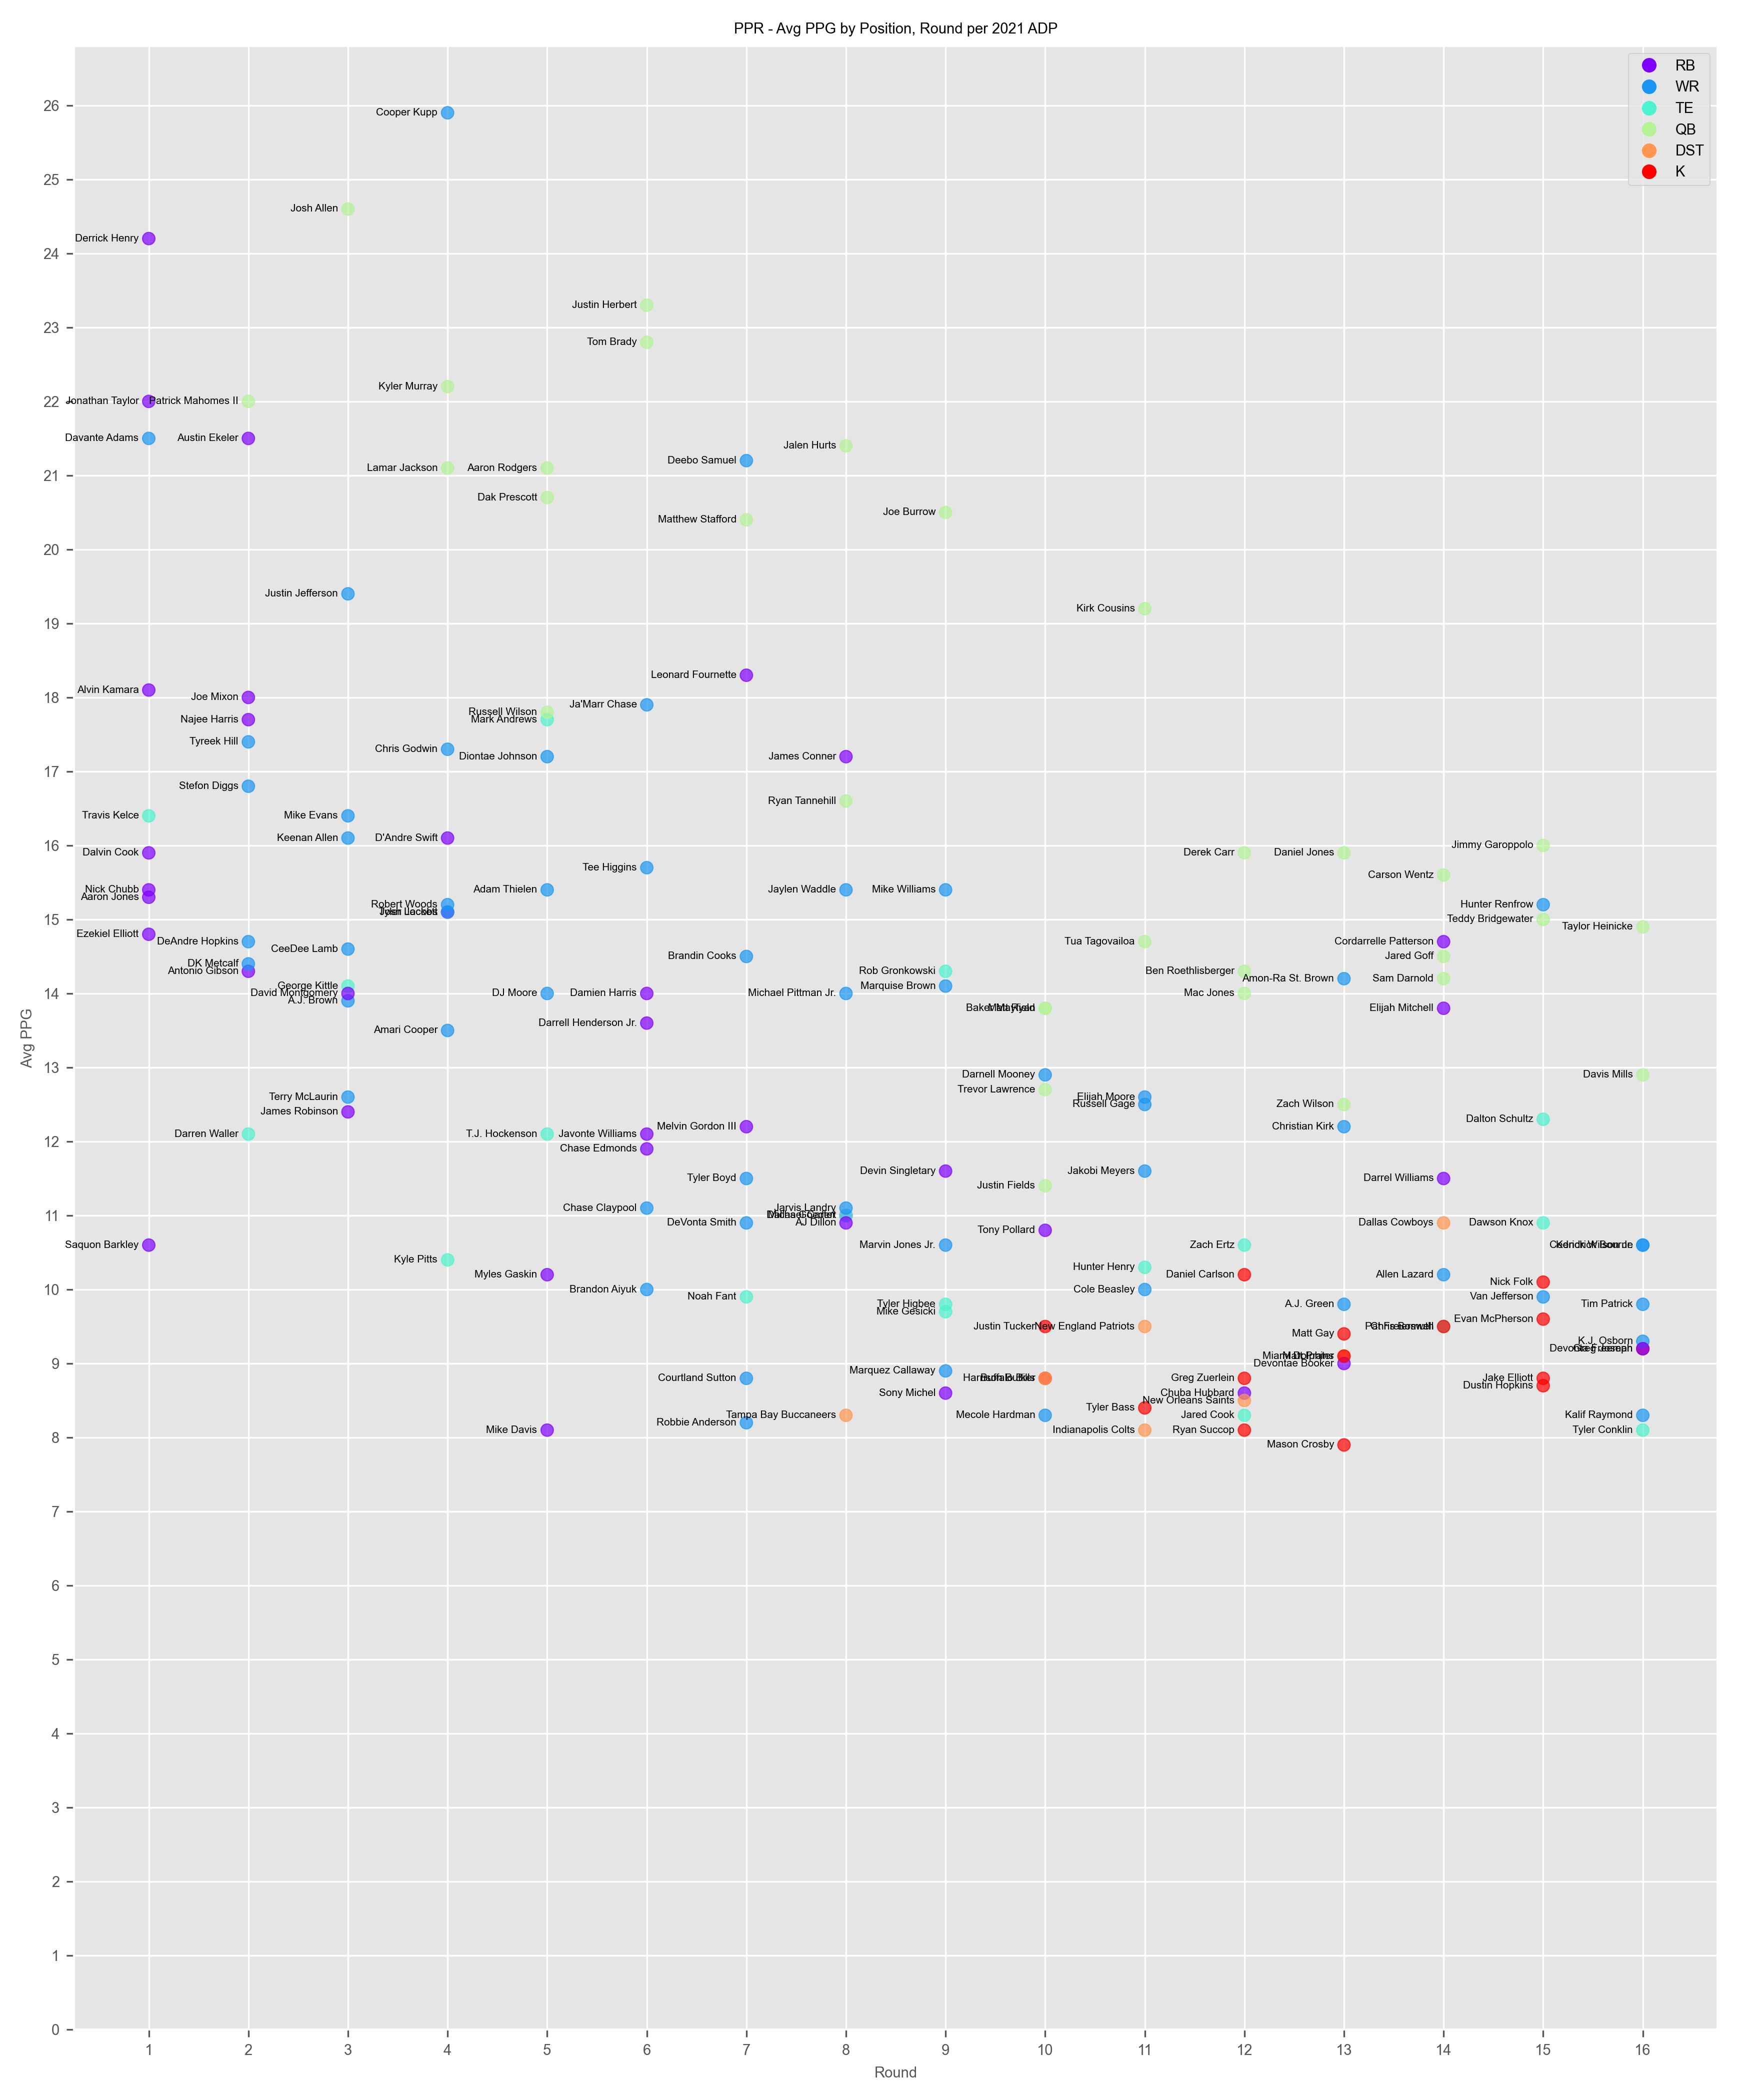
Prototype: average PPG by position, round per 2021 ADP
July 18, 2022
- It's the dog days of summer and I'm scrolling r/fantasyfootball to pass the soul-crushing endlessness of it all... when a question strikes me: how can I get a general idea of when certain positions are coming off the draft board? Can I see it all in one image? Would knowing that information help me find better value in the draft? Let's find out.
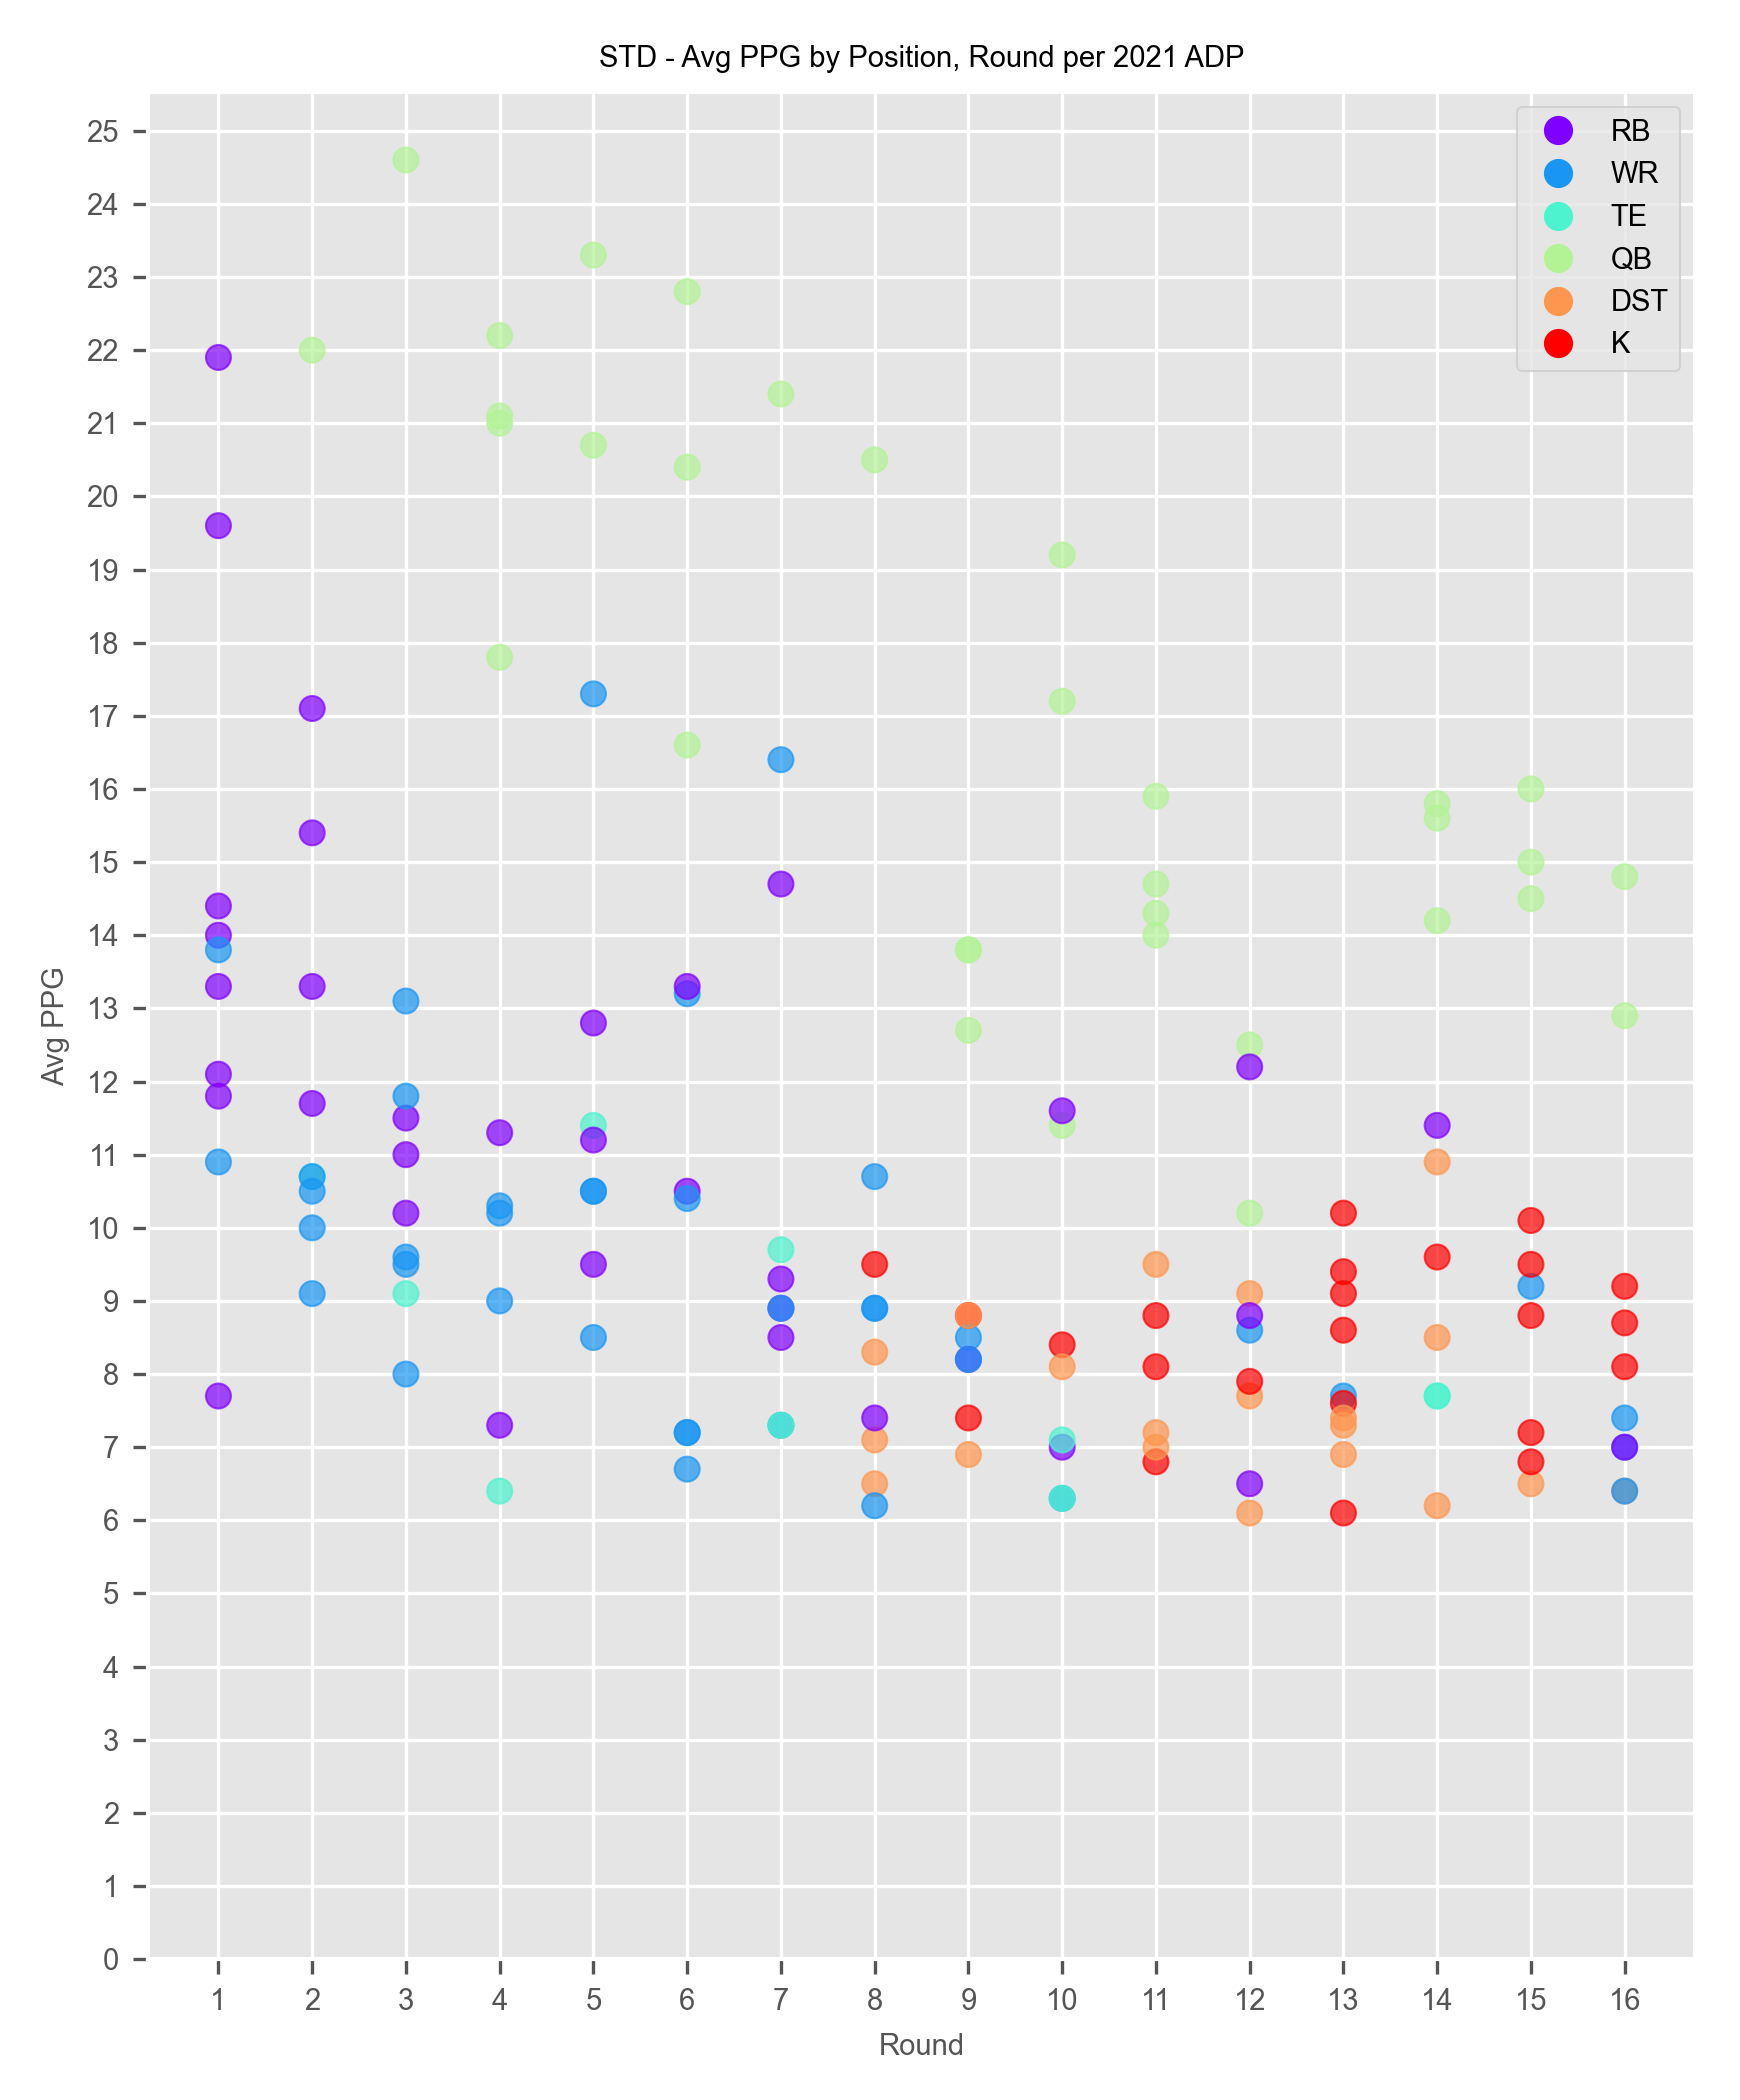
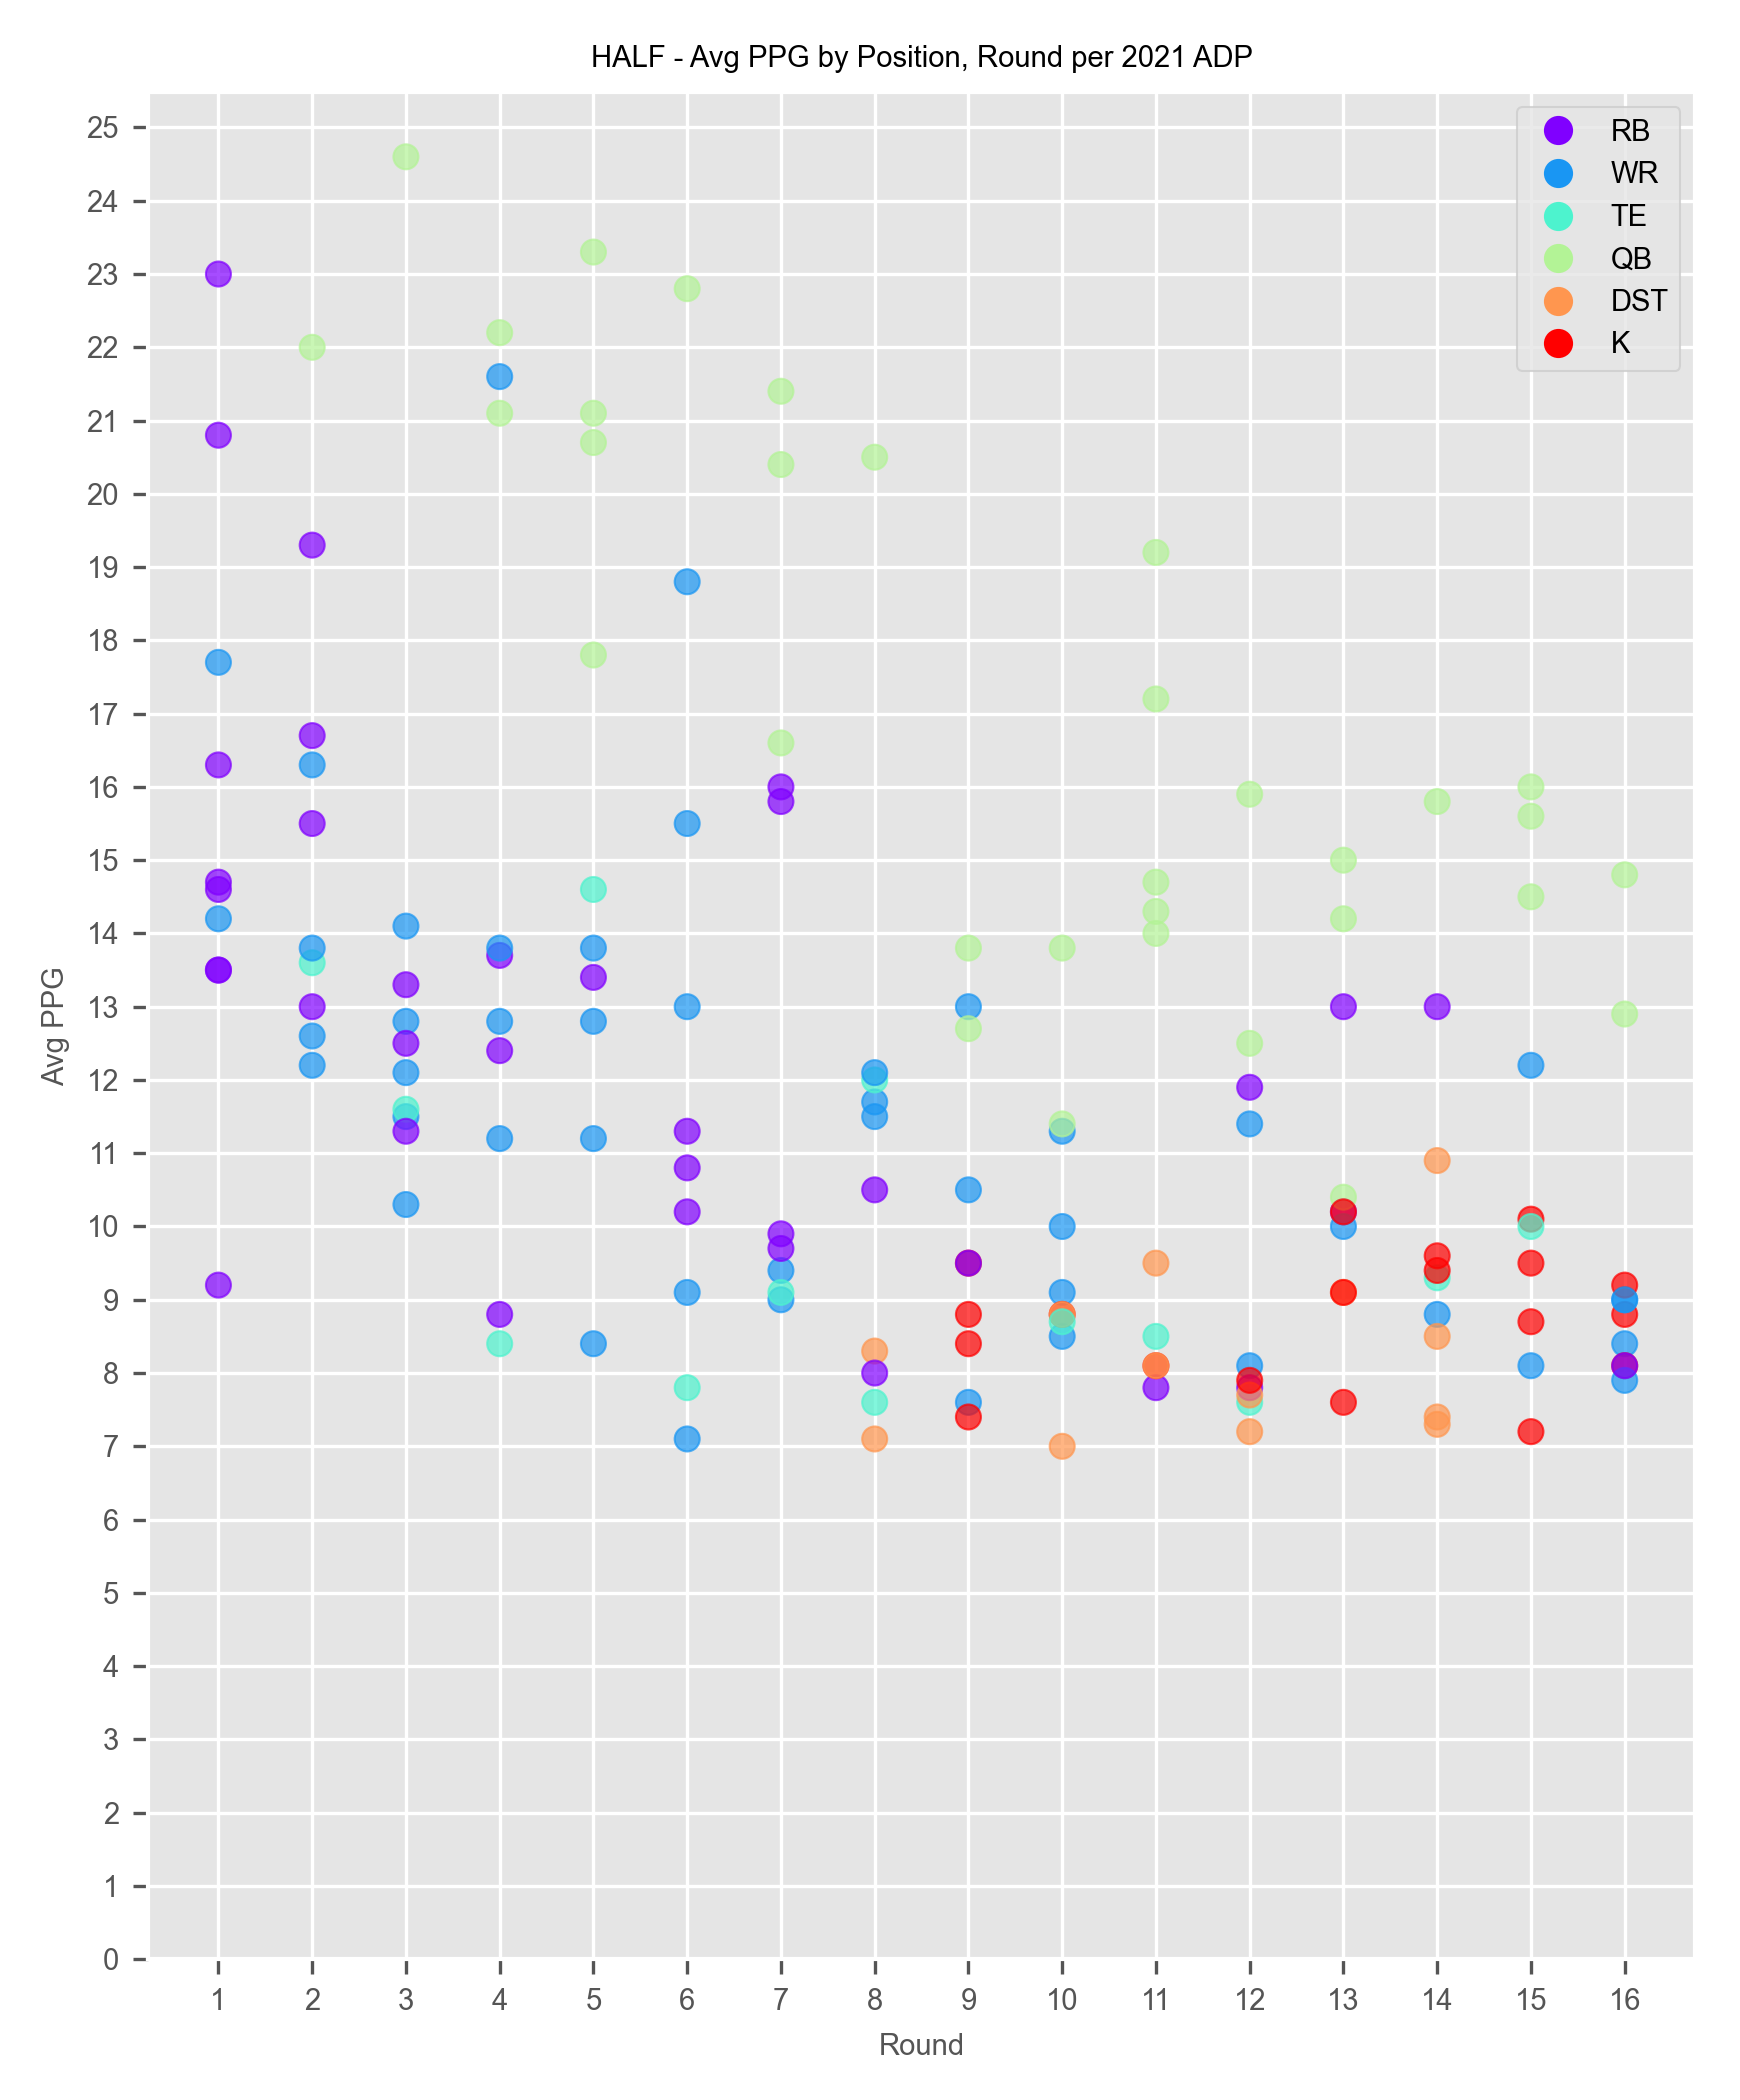
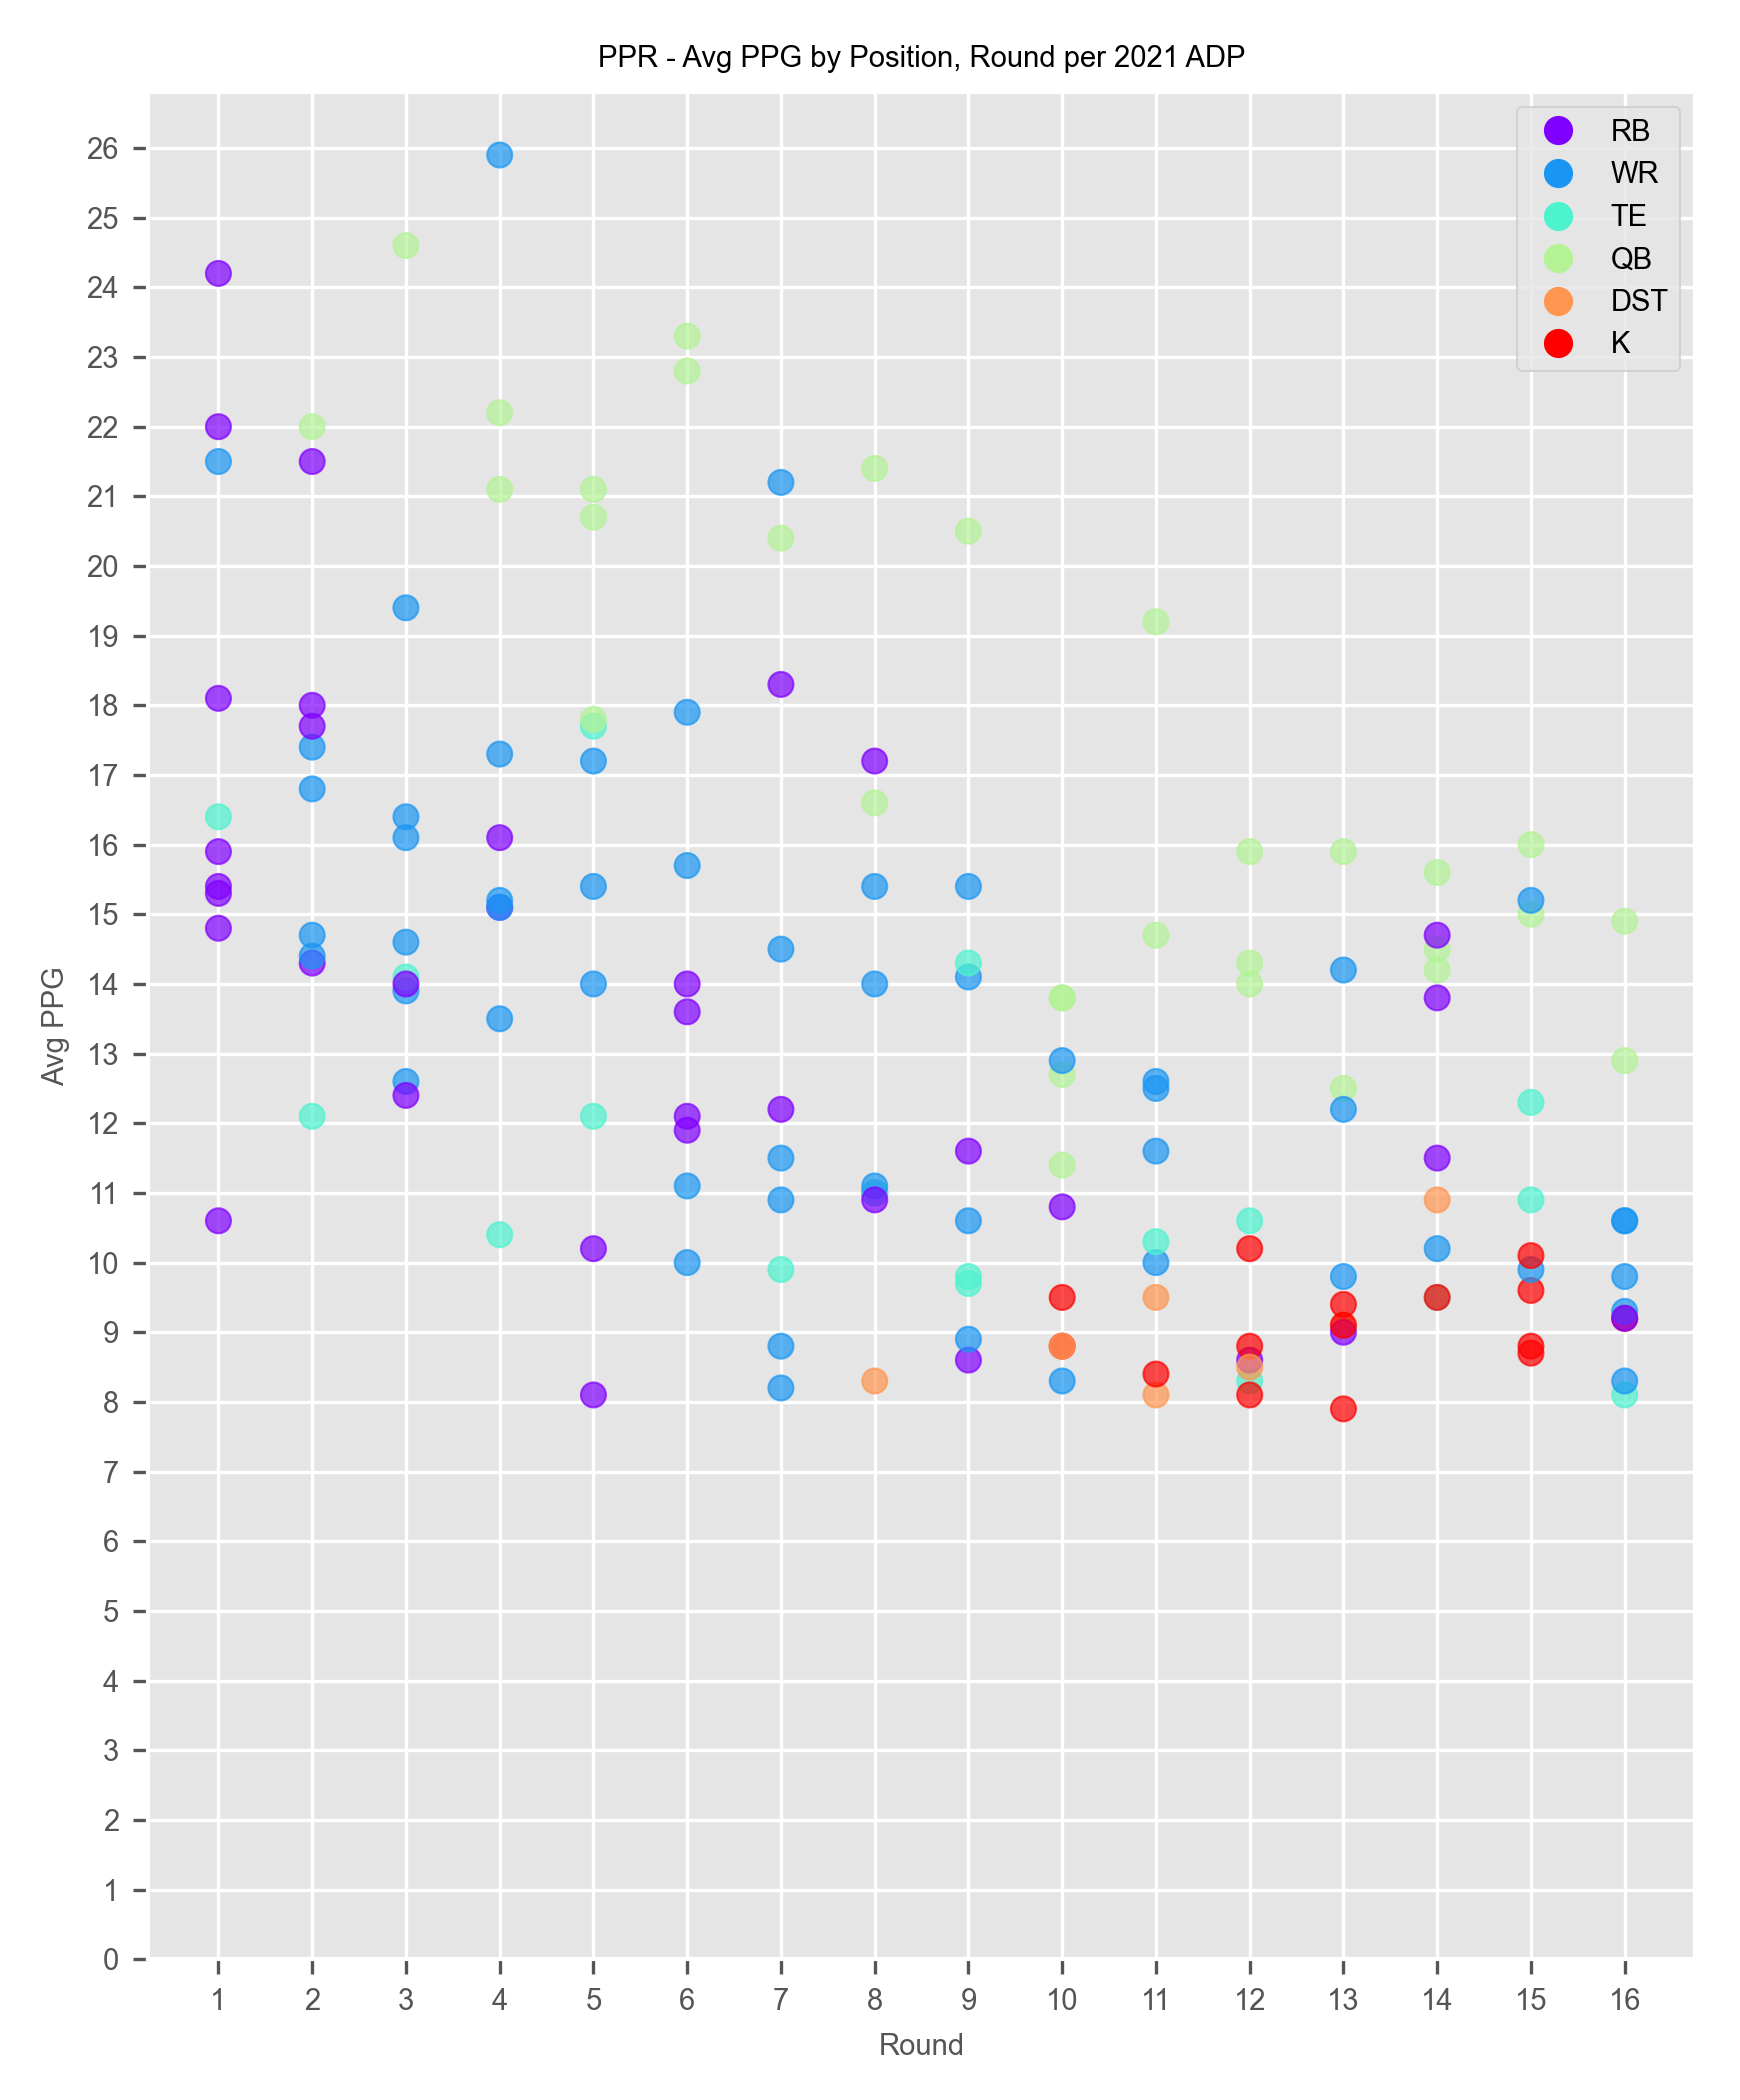
- And there you have it: plots for each scoring method (STD, HALF, PPR) that show average points per game by position and by round drafted. What can we learn from it? Here are my takeaways:
- You can't win your league in the first round, but you can lose it (lookin' at you, RBs).
- If you want any hope of a decent QB, you've gotta get one in the first 8 rounds. Most of the good ones are gone by round 6.
- PPR formats offer way better value deeper in the draft for WRs. Duh.
- Outside of the elite TEs, there's no real trend. If you miss out on one of the top 3 to 4 guys, don't stress too much. Wait until round 8, pick somebody you think is okay and play the waiver if it doesn't work out.
- DST and K are both crapshoots. Don't even bother looking at them until round 11 or 12.
- Note: these plots are for 10-player leagues but can be easily adjusted to show 12 or any other number of players.